Fig. 10.
Download original image
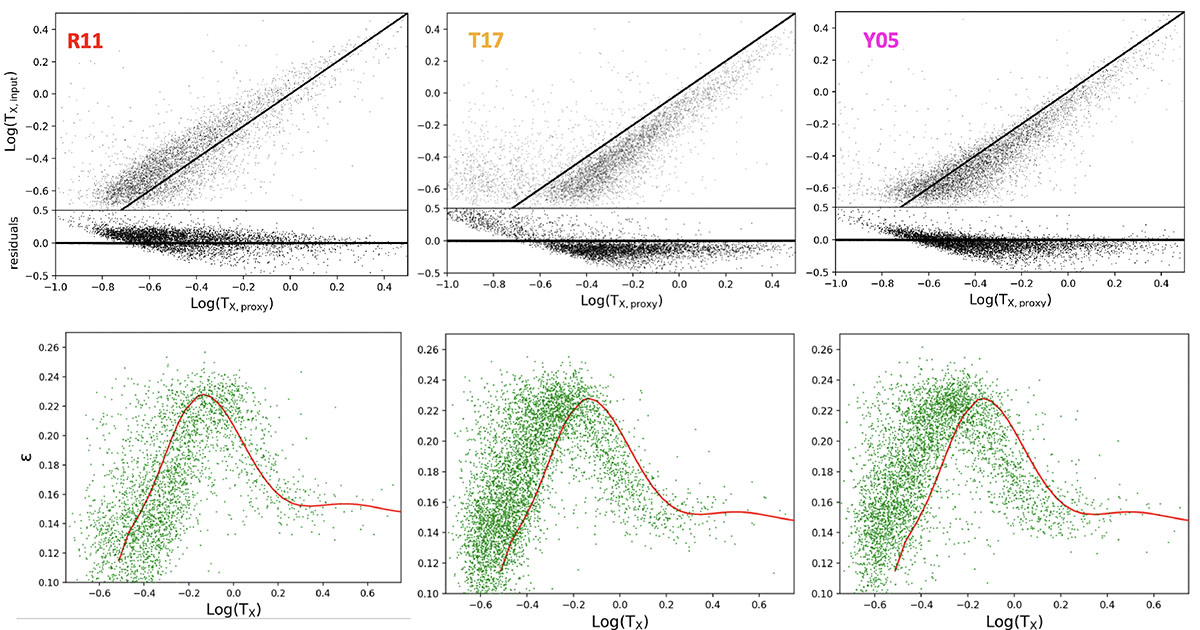
Upper panels: relation between the input mass-weighted gas temperature derived within r500 for the Magneticum halos and the temperature derived from the optical halo mass proxy through the scaling relation of Lovisari et al. (2015) for each prior catalog: R11 (left panel), T17 (central panel), and Y05 (right panel). Each panel also shows the residuals in dex as a function of the gas temperature proxy. Bottom panels: expected temperature–emissivity relation, at fixed metallicity (0.3 Z⊙), estimated at the input mass-weighted gas temperature derived within r500 for the Magneticum halos and the X-ray emissivity (red curve in each panel). The green points indicate the emissivity corresponding to the temperature proxy obtained from the optical halo mass proxy of the different optically selected group samples (R11 left panel, T17 central panel, and Y05 right panel) and estimated for the same metallicity.
Current usage metrics show cumulative count of Article Views (full-text article views including HTML views, PDF and ePub downloads, according to the available data) and Abstracts Views on Vision4Press platform.
Data correspond to usage on the plateform after 2015. The current usage metrics is available 48-96 hours after online publication and is updated daily on week days.
Initial download of the metrics may take a while.