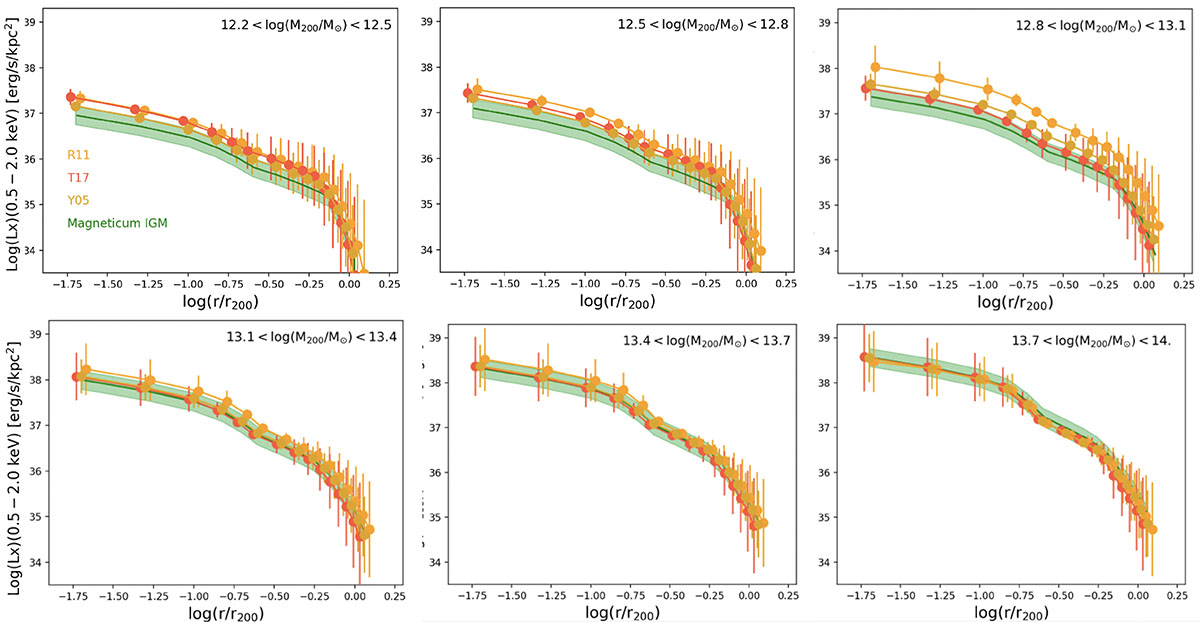
Fig. 11.
Download original image
Comparison in different halo mass bins between the PHOX input IGrM profiles convolved with the eROSITA PSF and averaged in input halo mass bins (green shaded region), with profiles averaged in halo mass proxy bins (colored symbols). The green-shaded region indicates the 1σ error. The colored points show the mean PHOX profiles obtained from the different prior catalogs (yellow for R11, orange for T17, and gold for Y05). The error bars indicate the 1σ uncertainty.
Current usage metrics show cumulative count of Article Views (full-text article views including HTML views, PDF and ePub downloads, according to the available data) and Abstracts Views on Vision4Press platform.
Data correspond to usage on the plateform after 2015. The current usage metrics is available 48-96 hours after online publication and is updated daily on week days.
Initial download of the metrics may take a while.