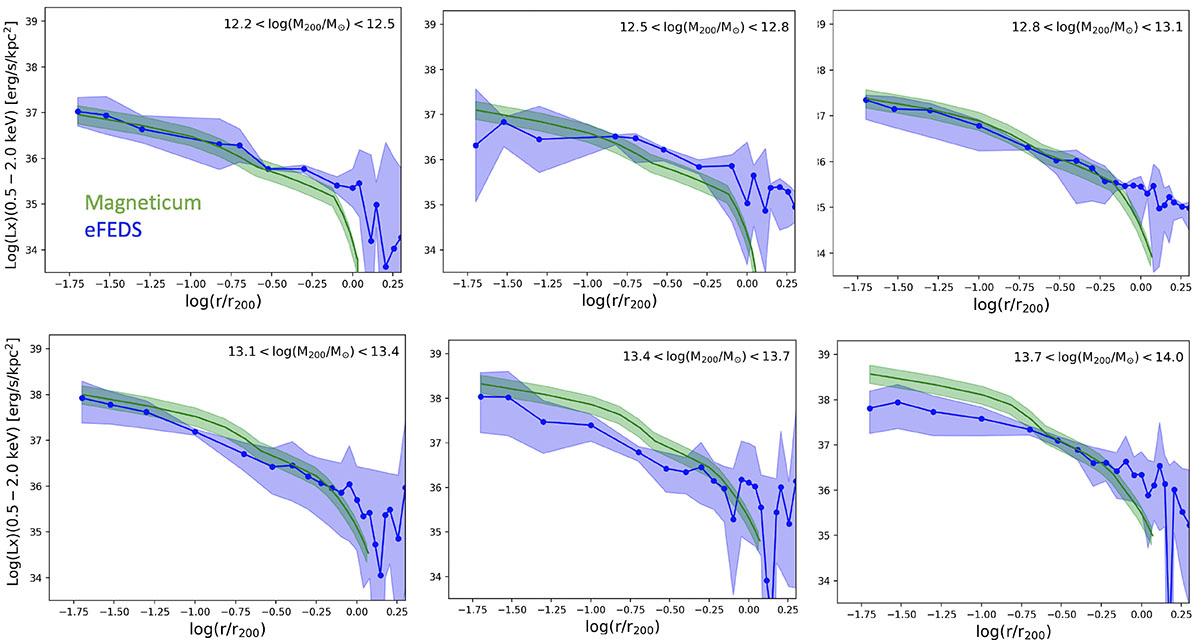
Fig. 14.
Download original image
Comparison in different halo mass bins between the PHOX input IGrM profiles convolved with the eROSITA PSF (green-shaded region) and the observed stacked profiles of Popesso et al. (2025, blue-shaded region). The latter profiles were obtained by following the same stacking procedure used here and with the real R11 GAMA optically selected group catalog. The shaded regions indicate the 1σ uncertainty.
Current usage metrics show cumulative count of Article Views (full-text article views including HTML views, PDF and ePub downloads, according to the available data) and Abstracts Views on Vision4Press platform.
Data correspond to usage on the plateform after 2015. The current usage metrics is available 48-96 hours after online publication and is updated daily on week days.
Initial download of the metrics may take a while.