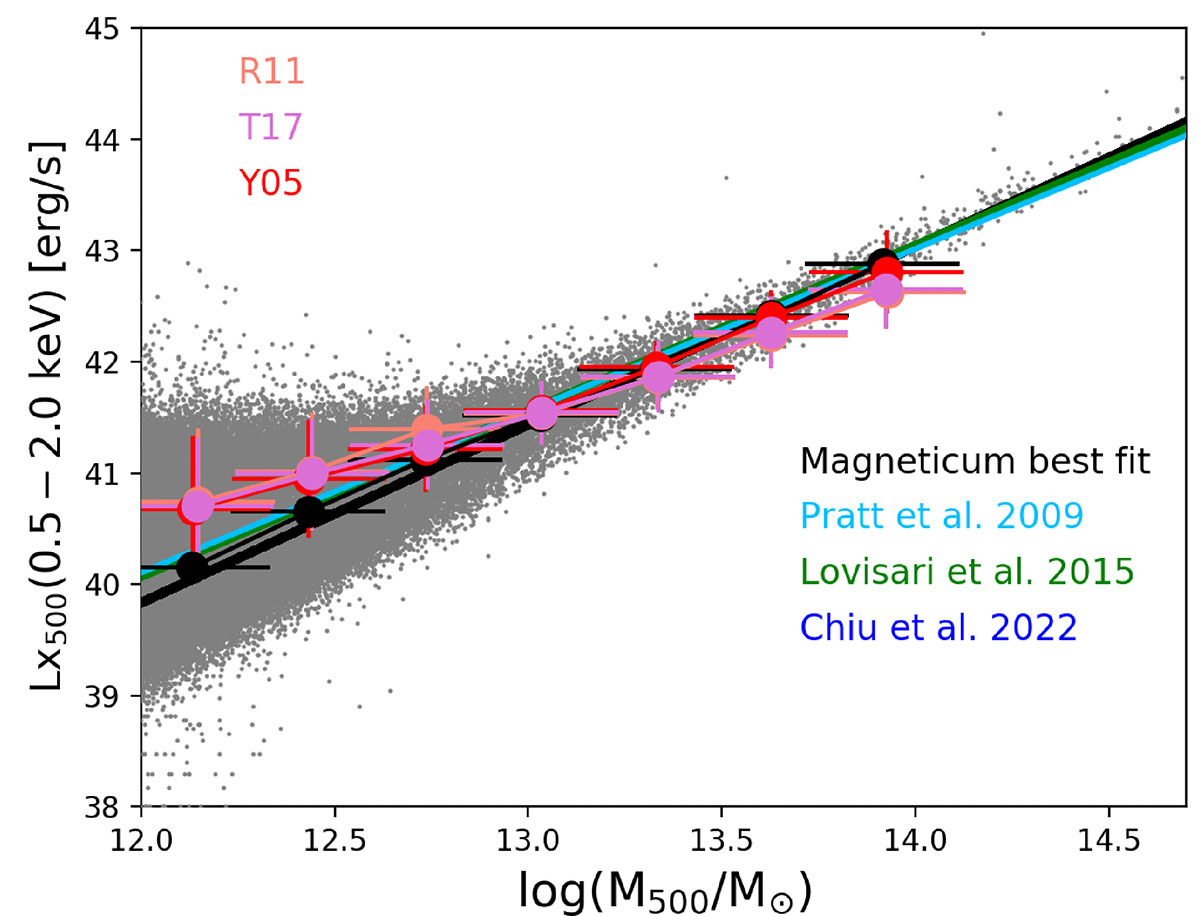
Fig. 16.
Download original image
LX–mass relation in the 0.5 − 2.0 keV band based on the stacking analysis applied to the Magneticum-eROSITA mock observations and based on the R11, T17 and Y05 optically selected galaxy group catalog. The relations are color coded as outlined in the figure: orange for R11, magenta for T17, and red for Y05 prior catalogs, respectively. The black symbols indicate the mean relation of the input Magneticum halos, while the black solid line indicates the best-fit obtained by considering input X-ray luminosity and mass for halos with M500 > 1013.5 M⊙. The cyan solid line indicates the relation of Pratt et al. (2009). The green solid line shows the relation of Lovisari et al. (2015) and the blue line the one of Chiu et al. (2022) in the 0.5 − 2.0 keV band.
Current usage metrics show cumulative count of Article Views (full-text article views including HTML views, PDF and ePub downloads, according to the available data) and Abstracts Views on Vision4Press platform.
Data correspond to usage on the plateform after 2015. The current usage metrics is available 48-96 hours after online publication and is updated daily on week days.
Initial download of the metrics may take a while.