Fig. 17.
Download original image
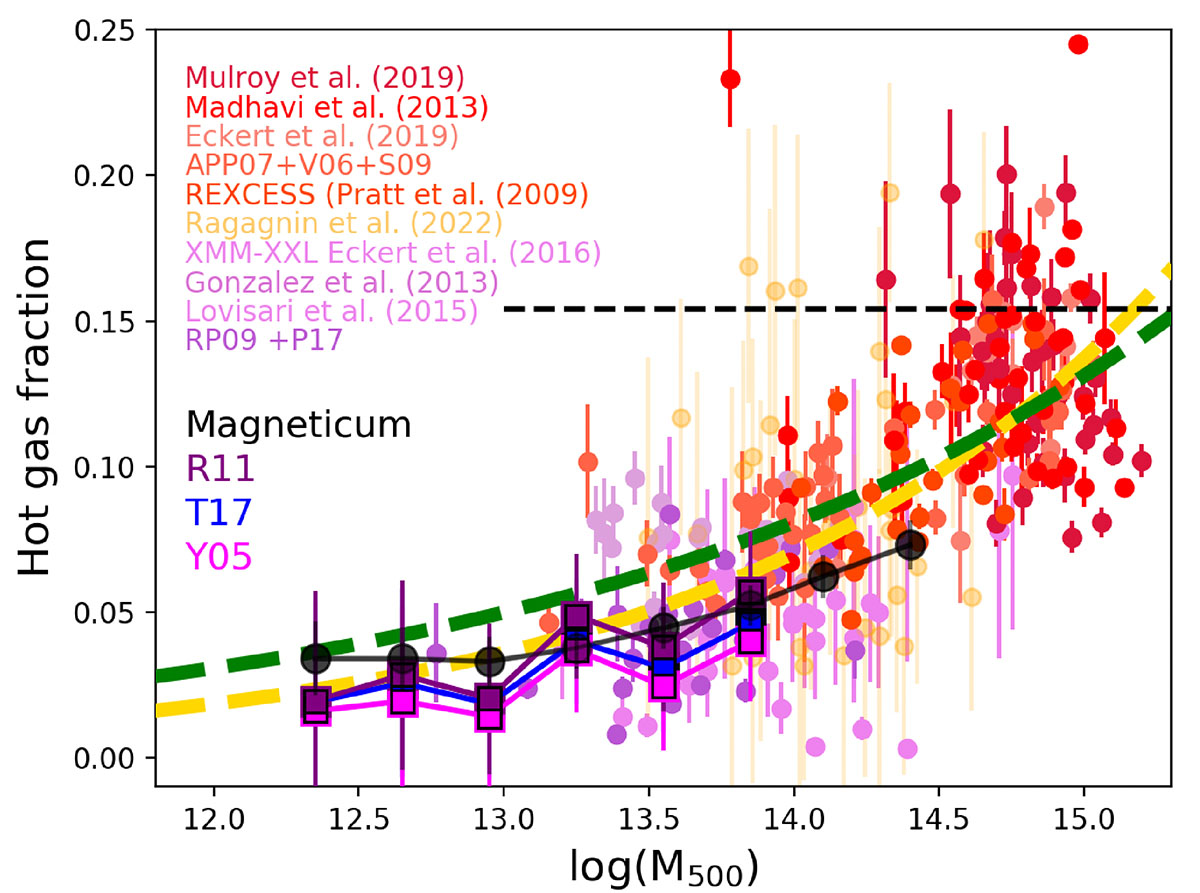
fgas − M500 relation. The filled circles represent a compilation of literature data, color coded as a function of the sample reference as shown in the picture. The black points connected by a solid line represent the Magneticum prediction. The squares indicate the fgas derived from the stacked X-ray surface brightness profiles. This is obtained by integrating the best-fit electron density model of Fig. 13. The dashed yellow and green curves represent the best-fit of Pratt et al. (2009) and Eckert et al. (2016), respectively. The dashed line indicates the value of the cosmic baryon fraction according to the WMAP cosmology implemented in Magneticum.
Current usage metrics show cumulative count of Article Views (full-text article views including HTML views, PDF and ePub downloads, according to the available data) and Abstracts Views on Vision4Press platform.
Data correspond to usage on the plateform after 2015. The current usage metrics is available 48-96 hours after online publication and is updated daily on week days.
Initial download of the metrics may take a while.