Open Access
Fig. 3.
Download original image
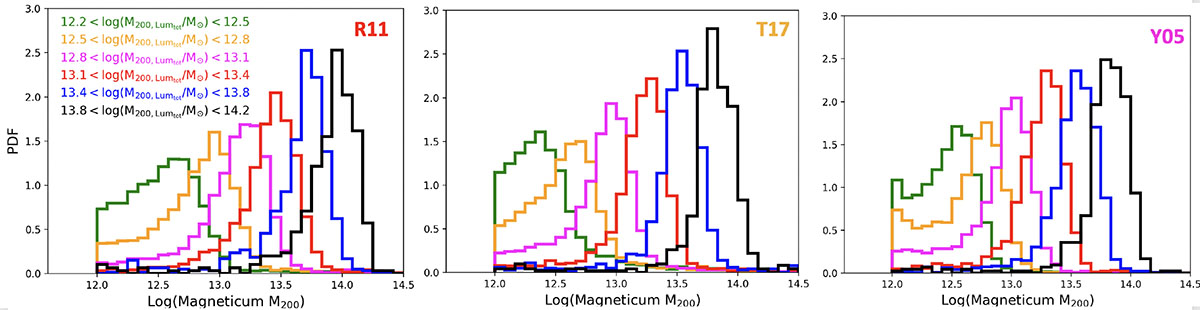
Input halo mass M200 distribution corresponding to different bins of halo mass proxy Mlum. The left panel shows the results of the R11 group sample, the central panel the T17 group sample, and the right panel the results of the Y05 sample. The color code is indicated in the left panel.
Current usage metrics show cumulative count of Article Views (full-text article views including HTML views, PDF and ePub downloads, according to the available data) and Abstracts Views on Vision4Press platform.
Data correspond to usage on the plateform after 2015. The current usage metrics is available 48-96 hours after online publication and is updated daily on week days.
Initial download of the metrics may take a while.