Fig. 4.
Download original image
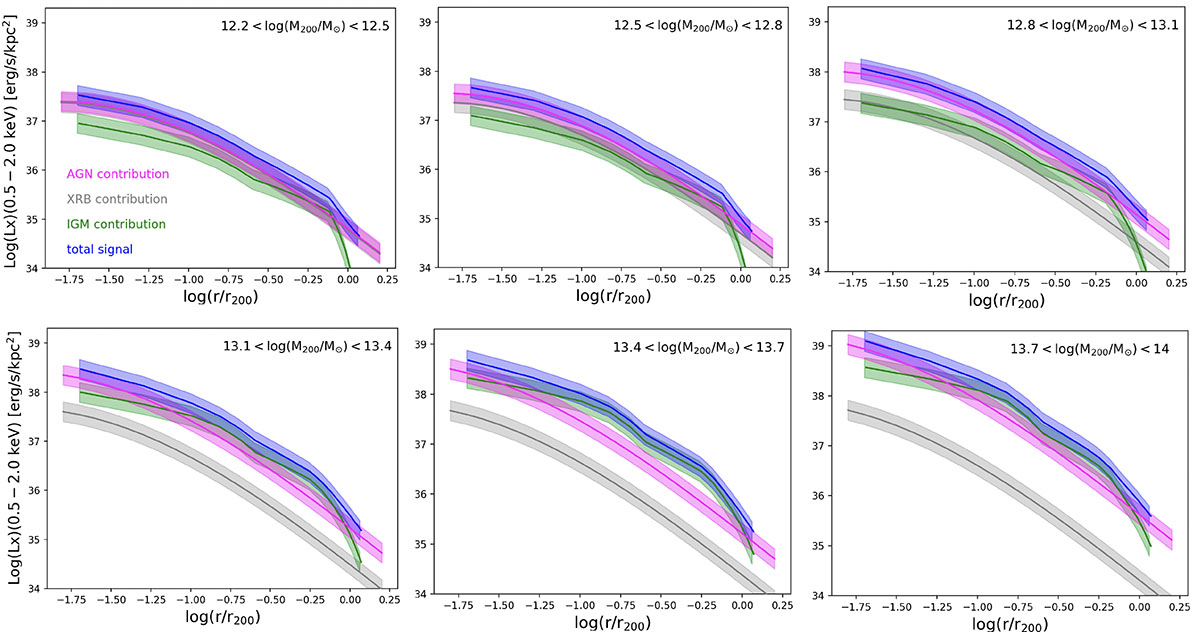
Predicted Magneticum X-ray surface brightness profiles per bin of halo mass. The profiles are obtained by convolving the PHOX projected profiles with the eROSITA PSF. The blue-shaded regions indicate the total X-ray emission within 1σ of the mean. The magenta blue-shaded regions indicate the AGN contribution, while the gray-shaded regions indicate XRB emission. The green-shaded region indicates the IGrM emission.
Current usage metrics show cumulative count of Article Views (full-text article views including HTML views, PDF and ePub downloads, according to the available data) and Abstracts Views on Vision4Press platform.
Data correspond to usage on the plateform after 2015. The current usage metrics is available 48-96 hours after online publication and is updated daily on week days.
Initial download of the metrics may take a while.