Open Access
Fig. 8.
Download original image
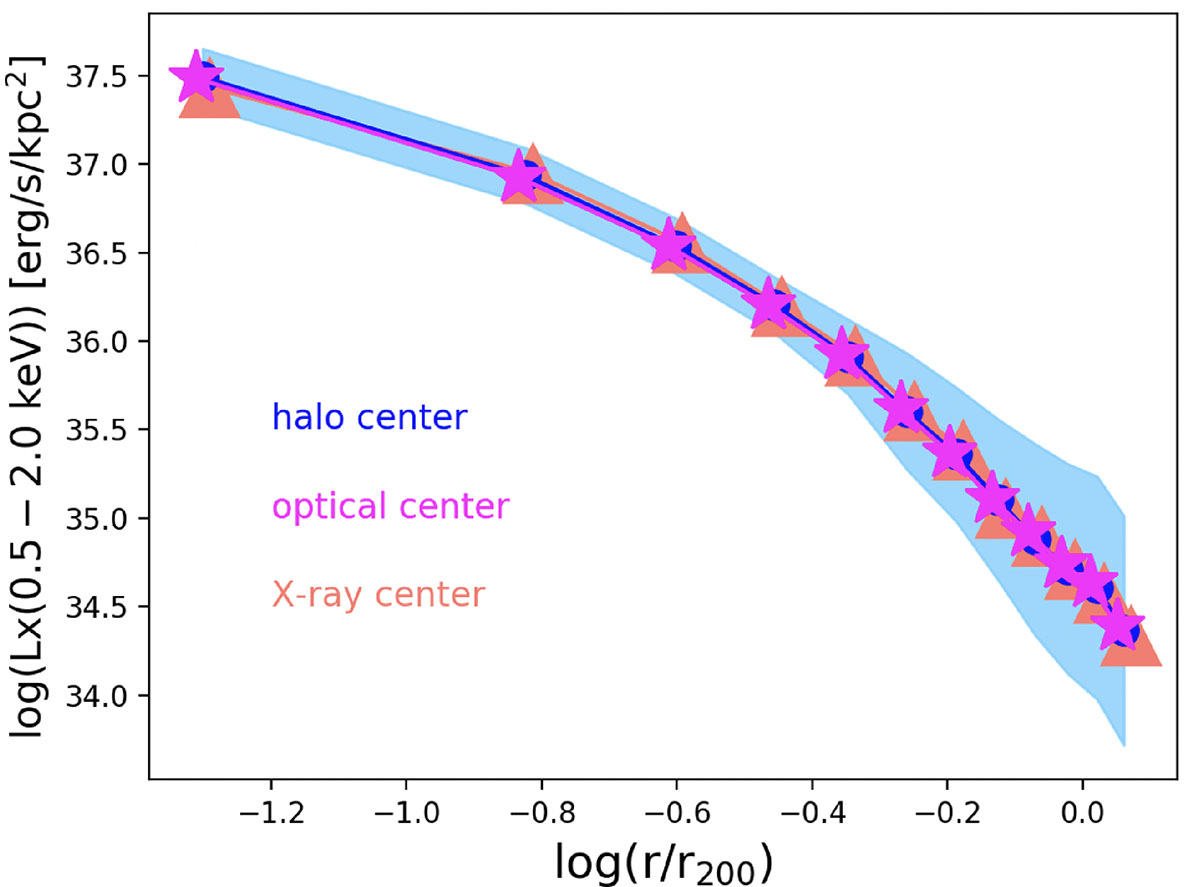
Comparison of the average projected PHOX profiles convolved with the eROSITA PSF and centered on the input halo center (blue points), the center coordinates of the R11 mock optically selected group sample (magenta symbols), and the X-ray center (orange triangle). The shaded region indicates the overlapping 1σ region.
Current usage metrics show cumulative count of Article Views (full-text article views including HTML views, PDF and ePub downloads, according to the available data) and Abstracts Views on Vision4Press platform.
Data correspond to usage on the plateform after 2015. The current usage metrics is available 48-96 hours after online publication and is updated daily on week days.
Initial download of the metrics may take a while.