Fig. 12
Download original image
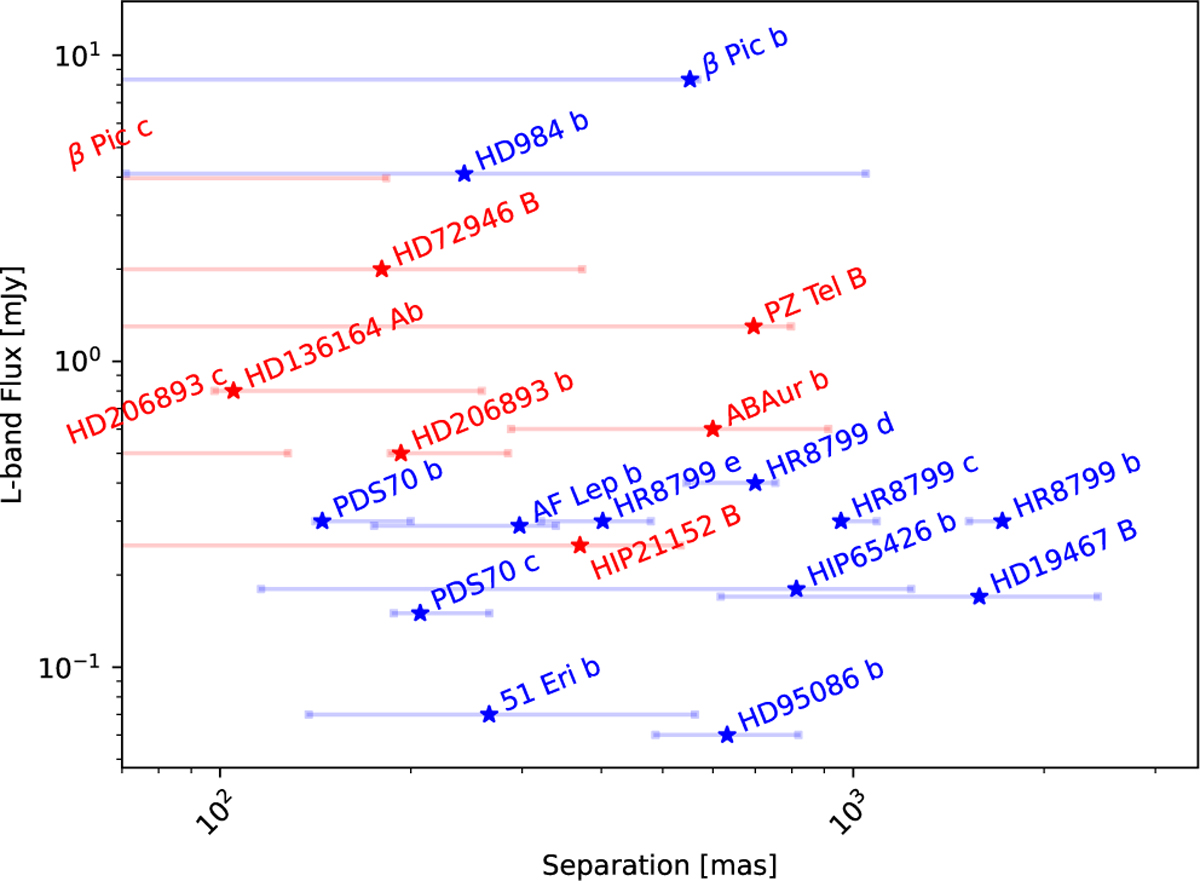
Angular separations and L-band fluxes of a sample of exoplanets and brown dwarfs. Fluxes are either directly taken from the literature (blue points) or computed with ATMO and/or ExoREM models using atmospheric parameters fitted in the literature (red points). Minimal and maximal separations are represented as segments, while the current position of the planet is marked with an asterisk (except for β Pic c and HD 206893 c that are currently well below the MATISSE inner working angle).
Current usage metrics show cumulative count of Article Views (full-text article views including HTML views, PDF and ePub downloads, according to the available data) and Abstracts Views on Vision4Press platform.
Data correspond to usage on the plateform after 2015. The current usage metrics is available 48-96 hours after online publication and is updated daily on week days.
Initial download of the metrics may take a while.