Open Access
Fig. B.3
Download original image
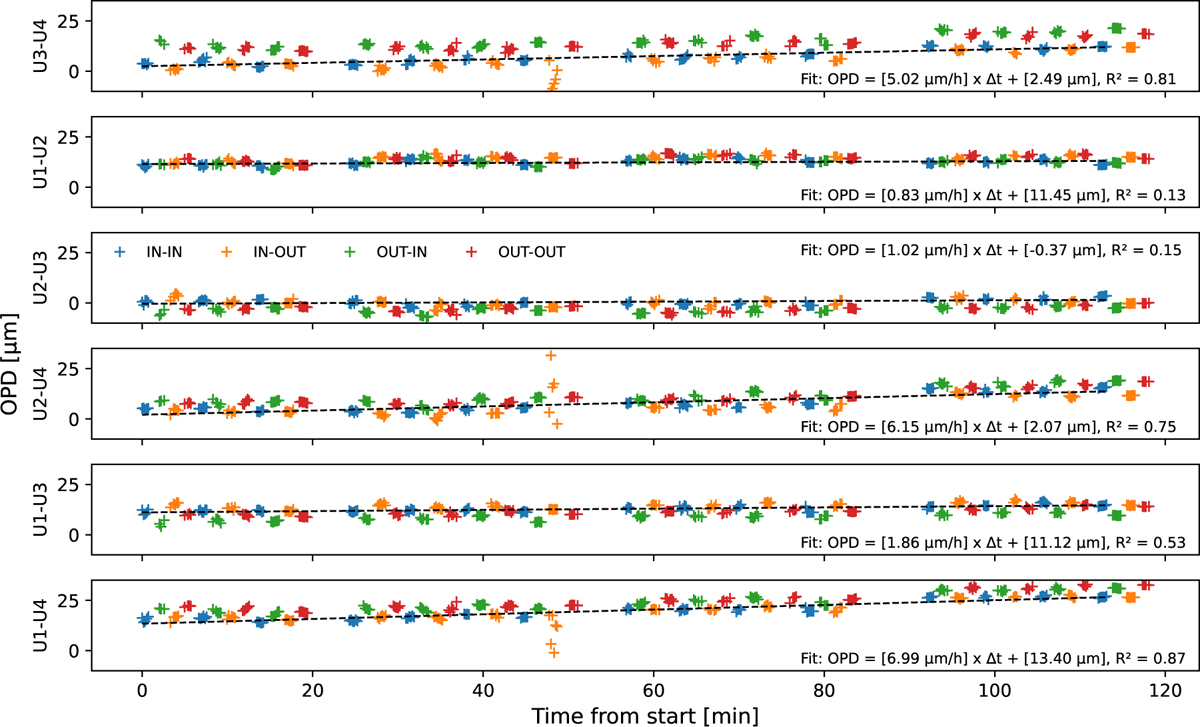
Temporal evolution of the non-common path OPD fitted on the data. The colours represent different BCD positions. The dashed line shows a linear fit on the frames using the IN-IN BCD position (blue crosses). The fit parameters and coefficient of determination are printed in each subplot.
Current usage metrics show cumulative count of Article Views (full-text article views including HTML views, PDF and ePub downloads, according to the available data) and Abstracts Views on Vision4Press platform.
Data correspond to usage on the plateform after 2015. The current usage metrics is available 48-96 hours after online publication and is updated daily on week days.
Initial download of the metrics may take a while.