Fig. 5
Download original image
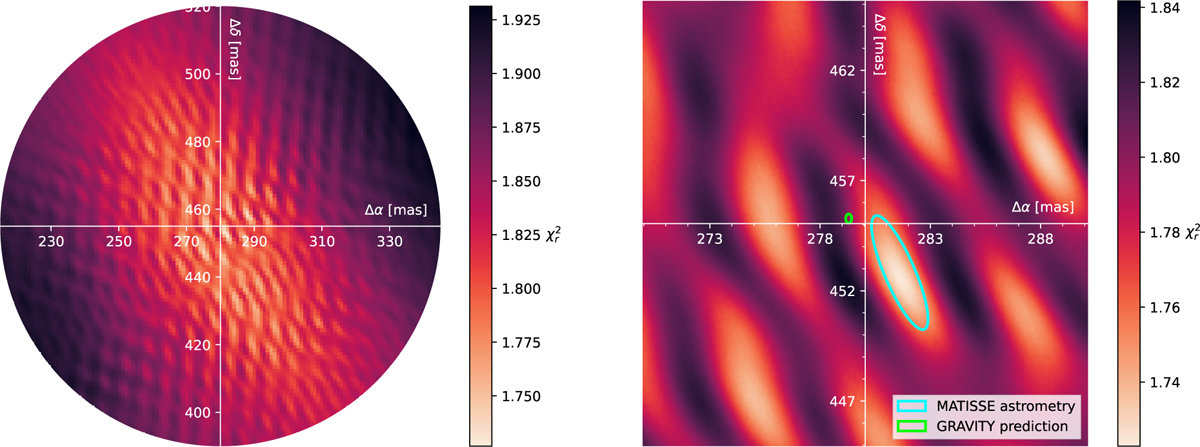
Detection maps of β Pic b with MATISSE. The maps show the reduced χ2 values after fitting the stellar contamination for each tested planet astrometry (Δα, Δδ) in the grid. The grids are centred on MATISSE’s pointing during the planet observations. The left map is the size of the pinhole (1.5λ/D at 3.5 μm) and has a resolution of 1 mas. The right map was generated at higher resolution (0.1 mas) on a smaller 20 × 20 mas grid. The most likely astrometry from the MATISSE observations is shown as a blue ellipse, found by fitting a 2D Gaussian curve on the lowest ![]() peak. The planet location and uncertainties predicted by whereistheplanet from the orbital fitting of GRAVITY observations (Lacour et al. 2021) are shown as a green ellipse. The multiplicity of
peak. The planet location and uncertainties predicted by whereistheplanet from the orbital fitting of GRAVITY observations (Lacour et al. 2021) are shown as a green ellipse. The multiplicity of ![]() peaks is due to the interferometric nature of our data. As coherent flux is periodic as a function of α.u (see Eq. (7)), an infinity of astrometric solutions can reproduce the signal. This degeneracy gradually disappears when combining data from different baseline lengths and orientations. The
peaks is due to the interferometric nature of our data. As coherent flux is periodic as a function of α.u (see Eq. (7)), an infinity of astrometric solutions can reproduce the signal. This degeneracy gradually disappears when combining data from different baseline lengths and orientations. The ![]() of neighbour peaks can nonetheless still remain close. Using covariances between baselines and wavelengths could help increase the difference between peaks, and will be studied in a future work.
of neighbour peaks can nonetheless still remain close. Using covariances between baselines and wavelengths could help increase the difference between peaks, and will be studied in a future work.
Current usage metrics show cumulative count of Article Views (full-text article views including HTML views, PDF and ePub downloads, according to the available data) and Abstracts Views on Vision4Press platform.
Data correspond to usage on the plateform after 2015. The current usage metrics is available 48-96 hours after online publication and is updated daily on week days.
Initial download of the metrics may take a while.