Fig. 6
Download original image
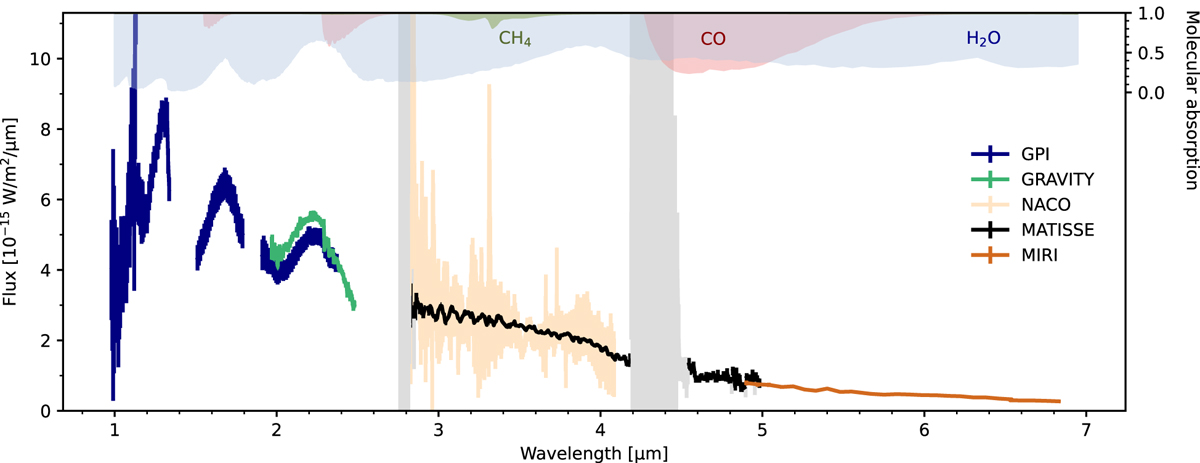
Spectrum of β Pic b with MATISSE (black, this work) compared to other instruments: NACO (yellow, new data), GPI (blue, Chilcote et al. 2017), GRAVITY (green, new data) and MIRI (red, Worthen et al. 2024). Only the slope of the NACO spectrum can be compared to MATISSE as the absolute level was scaled manually. MATISSE data with a S/N < 5, located in strong telluric bands and not used in this work, are shown in grey. The absorption curves of H2O, CO, and CH4, calculated from the best-fitting Exo-REM model presented in Sect. 5, are plotted at the top to visualize their impact on the spectrum. H2O and CO leaves a visible pattern, but not CH4, likely because it is dominated by H2O absorption or buried in noise.
Current usage metrics show cumulative count of Article Views (full-text article views including HTML views, PDF and ePub downloads, according to the available data) and Abstracts Views on Vision4Press platform.
Data correspond to usage on the plateform after 2015. The current usage metrics is available 48-96 hours after online publication and is updated daily on week days.
Initial download of the metrics may take a while.