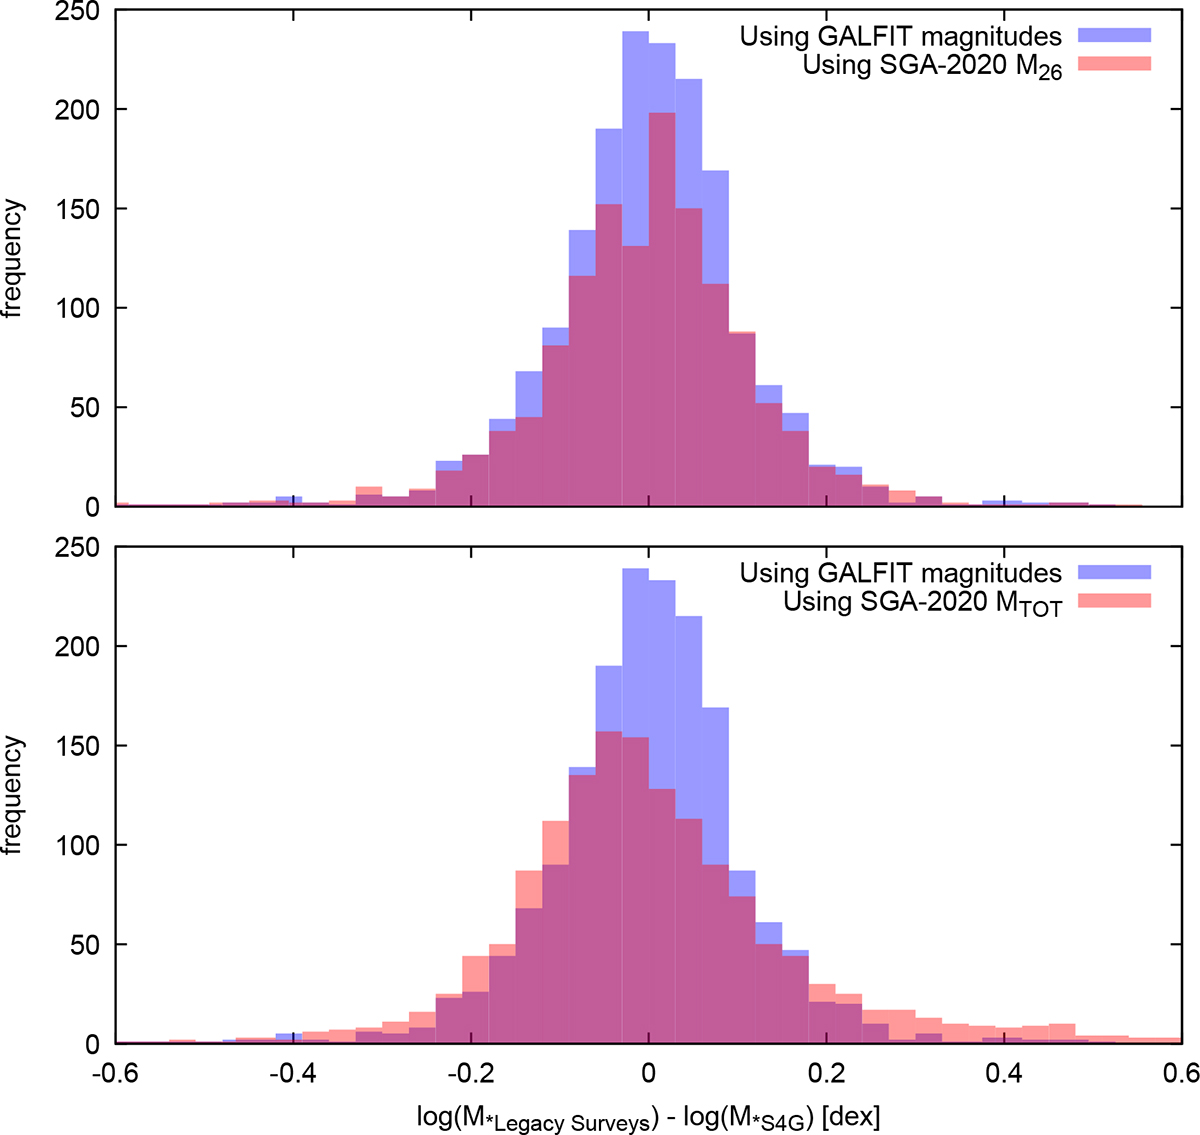
Fig. 4.
Download original image
Histogram of differences between S4G stellar masses and stellar masses recovered using aMg + bMr + c formulas: blue histograms – GALFIT magnitudes with parameters listed in Table 1, i.e., Eq. (1); the top red histogram – using SGA-2020 M26, i.e., Eq. (4); and the bottom red histogram – using SGA-2020 MTOT, parameter values of the formula used with SGA-2020 magnitudes are listed in Table 3.
Current usage metrics show cumulative count of Article Views (full-text article views including HTML views, PDF and ePub downloads, according to the available data) and Abstracts Views on Vision4Press platform.
Data correspond to usage on the plateform after 2015. The current usage metrics is available 48-96 hours after online publication and is updated daily on week days.
Initial download of the metrics may take a while.