Open Access
Fig. 5.
Download original image
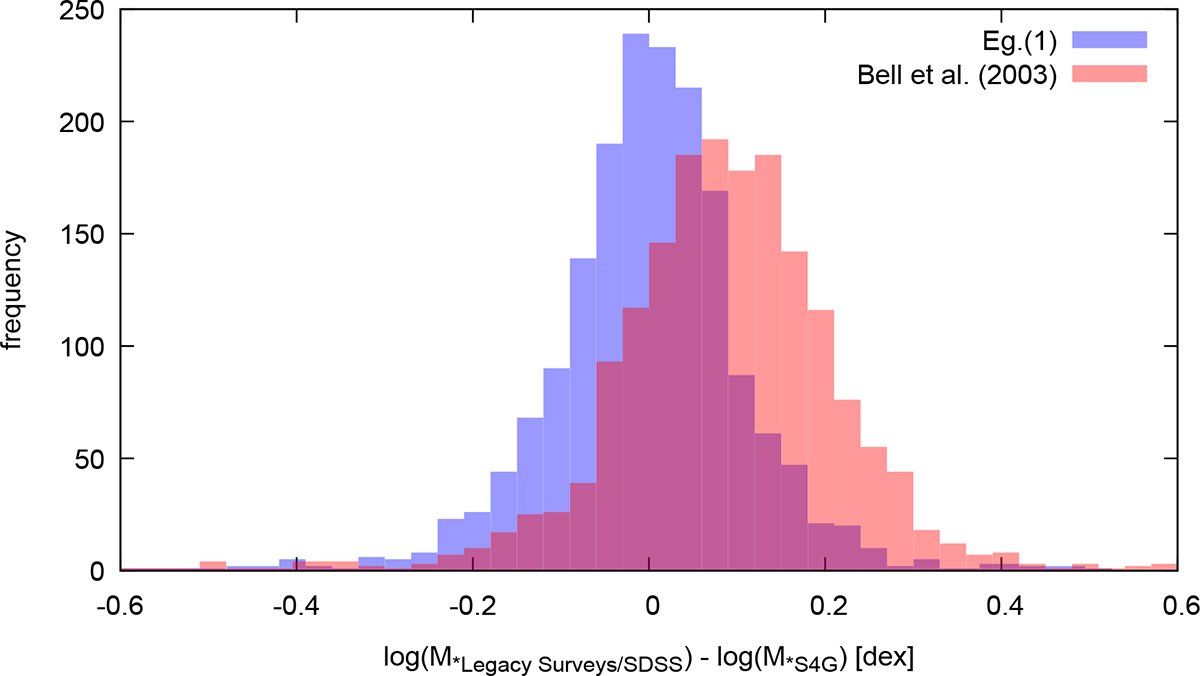
Histogram of differences between S4G stellar masses and stellar masses computed by Eq. (1) for the blue histogram and via mass-to-light ratios using tables in Bell et al. (2003) for the red histogram.
Current usage metrics show cumulative count of Article Views (full-text article views including HTML views, PDF and ePub downloads, according to the available data) and Abstracts Views on Vision4Press platform.
Data correspond to usage on the plateform after 2015. The current usage metrics is available 48-96 hours after online publication and is updated daily on week days.
Initial download of the metrics may take a while.