Fig. 3.
Download original image
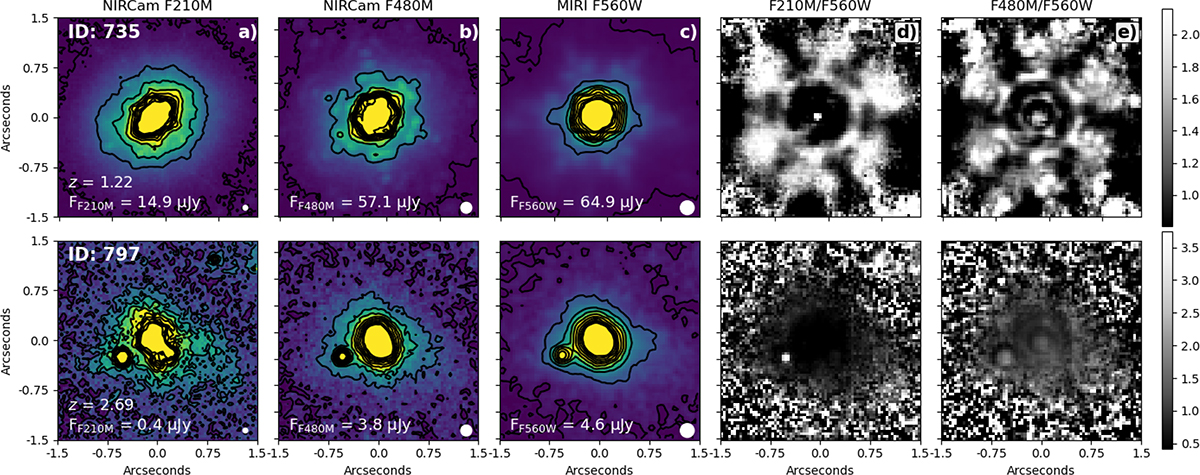
JWST multi-wavelength imaging and colour maps for two examples of the X-ray sources in our sample. The full sample is shown in Appendix D. For each galaxy, we show, and contour, a 3-arcsec cutout in the NIRCam F210M band (a), the NIRCam F480M band (b) and the MIRI F560W band (c). We label the galaxy’s ID given by Luo et al. (2017), measured flux in each band, and spectroscopic redshift. We also indicate the FWHM of the PSF in each band by the white circle in the lower right corner. The F210M/F560W (d) and F480M/F560W (e) colour maps are shown for each source, highlighting the presence of any AGN (point source) component at longer (NIR) wavelengths.
Current usage metrics show cumulative count of Article Views (full-text article views including HTML views, PDF and ePub downloads, according to the available data) and Abstracts Views on Vision4Press platform.
Data correspond to usage on the plateform after 2015. The current usage metrics is available 48-96 hours after online publication and is updated daily on week days.
Initial download of the metrics may take a while.