| Issue |
A&A
Volume 704, December 2025
|
|
|---|---|---|
| Article Number | A100 | |
| Number of page(s) | 16 | |
| Section | Extragalactic astronomy | |
| DOI | https://doi.org/10.1051/0004-6361/202553779 | |
| Published online | 03 December 2025 | |
MIDIS: Quantifying the active galactic nucleus component of X-ray-detected galaxies
1
Cosmic Dawn Center (DAWN), Copenhagen, Denmark
2
DTU Space, Elektrovej, Building 328, 2800 Kgs. Lyngby, Denmark
3
School of Physics & Astronomy, Space Park Leicester, University of Leicester, 92 Corporation Road, Leicester LE4 5SP, UK
4
Centro de Astrobiologıa (CAB), CSIC-INTA, Camino Bajo del Castillo s/n, 28692 Villanueva de la Cañada, Madrid, Spain
5
Centre for Extragalactic Astronomy, Department of Physics, Durham University, South Road, Durham DH1 3LE, UK
6
Leiden Observatory, Leiden University, PO Box 9513 NL-2300 RA Leiden, The Netherlands
7
Centro de Astrobiología (CAB), CSIC-INTA, Ctra. de Ajalvir km 4, Torrejón de Ardoz, E-28850 Madrid, Spain
8
Department of Astronomy, Stockholm University, Oscar Klein Centre, AlbaNova University Centre, 106 91 Stockholm, Sweden
9
Kapteyn Astronomical Institute, University of Groningen, P.O. Box 800 9700 AV Groningen, The Netherlands
10
Steward Observatory, University of Arizona, 933 North Cherry Avenue, Tucson AZ 85721, USA
11
Institute for Theoretical Physics, Heidelberg University, Philosophenweg 12, D–69120 Heidelberg, Germany
12
Space Telescope Science Institute (STScI), 3700 San Martin Drive, Baltimore, MD 21218, USA
13
Physikalisches Institut der Universität zu Köln, Zülpicher Str. 77, 50937 Köln, Germany
14
European Space Agency, ESA Office, Space Telescope Science Institute, 3700 San Martin Drive, Baltimore MD 21218, USA
15
DARK, Niels Bohr Institute, University of Copenhagen, Jagtvej 155, 2200 Copenhagen, Denmark
16
Telespazio UK for the European Space Agency, ESAC, Camino Bajo del Castillo s/n, 28692 Villanueva de la Cañada, Spain
17
Dept. of Astrophysics, University of Vienna, Türkenschanzstr. 17, A-1180 Vienna, Austria
18
ETH Zürich, Institute for Particle Physics and Astrophysics, Wolfgang-Pauli-Str. 27, 8093 Zürich, Switzerland
19
AIM, CEA, CNRS, Université Paris-Saclay, Université Paris Diderot, Sorbonne Paris Cité, F-91191 Gif-sur-Yvette, France
20
Dublin Institute for Advanced Studies, 31 Fitzwilliam Place, D02 XF86 Dublin, Ireland
⋆ Corresponding author: srigi@space.dtu.dk
Received:
16
January
2025
Accepted:
20
August
2025
X-ray and infrared surveys provide efficient, and to some degree complementary, means of detecting and characterising active galactic nuclei (AGNs), with the infrared also providing an important probe of the host galaxies. To this end we combine the deepest X-ray survey from the Chandra Deep Field-South (CDF-S) ‘7-Ms’ survey with the deepest mid-infrared (5.6 μm) image from the JWST/MIRI Deep Imaging Survey (MIDIS) in the Hubble Ultra-Deep Field (HUDF) to study the infrared counterparts and point-source emission of 31 X-ray sources with a median, intrinsic, rest-frame X-ray luminosity of log10(LXc0.5−7 keV) = 42.04 ± 0.22 erg s−1. The sample includes 24 AGNs with a redshift range, set by the X-ray detectability, of z ≃ 0.5−3, with the bulk of the sources lying at z ≃ 1−2, i.e. around the epoch of cosmic noon. Through a multi-wavelength morphological decomposition, employing three separate classifications (visual, parametric, and non-parametric), we separate (where present) the luminosity of the point-like AGN component from the remainder of the host-galaxy emission. The unprecedented mid-infrared sensitivity and imaging resolution of MIRI allows, in many cases, for the direct characterisation of point-like (i.e. unresolved) components in the galaxies’ emission. We establish a broad agreement between the three morphological classifications. At least 70% of the X-ray sources, including some classified as galaxies, show unresolved emission in the MIRI images, with the unresolved-to-total flux fraction at rest-frame 2 μm ranging from ∼0.2 to ∼0.9. At high X-ray luminosities (log10(LXc) > 43 erg s−1), we derive a consistent rest-frame near-infrared 2 μm point-source luminosity to that derived for local AGNs, whilst at lower X-ray luminosities we identify an excess in the 2 μm emission compared to pre-JWST studies. We speculate that this offset may be driven by a combination of Compton-thick AGN components and nuclear starburst, merger-driven activity. Our observations highlight the complex nature of X-ray sources in the distant Universe and demonstrate the power of JWST/MIRI in quantifying their nuclear infrared emission.
Key words: galaxies: active / galaxies: high-redshift / galaxies: structure / X-rays: galaxies
© The Authors 2025
 Open Access article, published by EDP Sciences, under the terms of the Creative Commons Attribution License (https://creativecommons.org/licenses/by/4.0), which permits unrestricted use, distribution, and reproduction in any medium, provided the original work is properly cited.
This article is published in open access under the Subscribe to Open model. Subscribe to A&A to support open access publication.
1. Introduction
Since the discovery that the cosmic X-ray background was isotropic (Fabian & Barcons 1992), there followed major interest in determining the contributions of discrete source populations, as a function of X-ray energy (e.g. Comastri et al. 1995; Ueda et al. 2003). These studies combined the results from all-sky catalogues that sampled the discrete sources at limited X-ray sensitivity, with deeper serendipitous samples of sources scattered around the sky e.g. using Chandra and XMM-Newton. Cappelluti et al. (2017) demonstrated that more than 90% of the X-ray background below 10 keV can be resolved into different classes of active galactic nuclei (AGNs), including unabsorbed sources, partially obscured sources, and Compton-thick sources (i.e. those with a column density (NH) greater than 1.5 × 1024 cm−2) (Risaliti et al. 1999). At energies greater than 10 keV, the fractions of the AGN population change in favour of the obscured sources. Although there is a correlation between X-rays and the mid-infrared (MIR) (e.g. Gandhi et al. 2009; Asmus et al. 2015), it was shown that using a MIR colour selection criterion based on the WISE all sky survey (e.g. Stern 2015), missed a significant fraction of AGNs detected in hard X-ray by NuSTAR and XMM-Newton (Mateos et al. 2012). Since the Mid Infrared Instrument (MIRI; Wright et al. 2023) on board JWST offers so much greater sensitivity and spatial resolution compared with all previous mid-IR facilities, it is now possible to spatially resolve high redshift (z > 1) galaxies in the mid-infrared (Boogaard et al. 2024; Costantin et al. 2025).
The contribution of an AGN to a galaxy’s spectral energy distribution (SED) peaks at mid-infrared wavelengths, especially for dust-obscured sources whose non-stellar emission is reprocessed through hot and warm dust emission (Hickox & Alexander 2018). With MIRI observations it is thus possible to isolate the unresolved AGN-heated dust emission in the rest-frame near-infrared (NIR) spectral range at much higher redshifts than is possible with NIRCam (Tanaka et al. 2024). At rest-frame 2−3.5 μm, type 1 (un-obscured) nearby AGNs show a strong correlation between the hard (2−10 keV) X-ray and the non-stellar (unresolved component) luminosities, while type 2 ones lie below the correlation when torus obscuration effects are not corrected for (see e.g. Kotilainen et al. 1992; Alonso-Herrero et al. 1997; Burtscher et al. 2015). Thus, it is interesting to examine a sample of X-ray selected sources (AGNs and galaxies, see below) detected in the MIRI Deep Imaging Survey (MIDIS; Östlin et al. 2025) field. This provides new information regarding the presence or absence of an AGN dust-heated nuclear component and its contribution with respect to the host galaxy emission, even in low-X-ray-luminosity galaxies where part of the X-ray emission may have stellar origins (e.g. X-ray binaries, shocks), and thus provides insights into the nature of the host galaxy (e.g. Gao et al. 2003; Lehmer et al. 2010; Barrows et al. 2024).
In this paper, we present a morphological analysis of a sample of 31 X-ray-selected sources in the MIDIS field with the goal of estimating the unresolved emission associated with AGN-heated dust. In Section 2 we present the parent X-ray catalogue from the Chandra 7-Ms survey before outlining the other observations and data reduction in Section 3. In Section 4 we define the sample of X-ray sources in the MIDIS survey and present the analysis of multi-wavelength JWST observations with the associated results and discussion in Section 5, before summarising our main conclusions in Section 6. Throughout the paper, we assume a ΛCDM cosmology with Ωm = 0.3, ΩΛ = 0.7, and H0 = 70 km s−1 Mpc−1. All quoted magnitudes are in the AB system and stellar masses were calculated assuming a Chabrier initial mass function (Chabrier 2003). All uncertainties reported on median values are bootstrapped uncertainties.
2. The sample: CDF-S X-ray sources
We used the X-ray source catalogue from the Chandra Deep Field-South (CDF-S) ‘7-Ms’ survey (Luo et al. 2017)1 to identify the infrared (IR) counterparts to galaxies with detected X-ray emission in the MIDIS field. To date, this set of observations comprises the deepest X-ray survey conducted anywhere in the sky, and hence represents the most sensitive search for AGN X-ray emission, outside of observations utilising gravitational lensing to augment the luminosity and redshift reach (e.g. Bogdán et al. 2024).
CDF-S covers a roughly circular region of sky, with total area 484 arcmin2; it encompasses, and is roughly concentric with, the GOODS-S survey region; hence, it also contains the HUDF, and thus MIDIS, which are located towards the central, most sensitive part of CDF-S. The CDF-S source survey is flux-limited, with a full-band (0.5−7 keV) point-source threshold ranging from 3 × 10⁻¹⁷ erg cm−2 s−1 close to the survey centre, to 10−15 erg cm−2 s−1 near to the survey perimeter (Luo et al. 2017, Fig. 29). The main source catalogue contains 1008 sources above the detection-significance threshold. There is a supplementary catalogue of 47 lower-significance sources included due to proximity to bright NIR candidate counterparts. We refer to the main-catalogue sources by the running number (‘XID’) assigned by Luo et al. (2017), while for the supplementary list we prefix the XID with ‘S-’ to avoid ambiguity. As is detailed in Luo et al. 2017, the main catalogue has a median (combined spectroscopic (65%) + photometric) redshift of z = 1.2 ± 0.05 with a 16th − 84th percentile range of z = 0.52−2.32. The median intrinsic (i.e. rest-frame), absorption-corrected X-ray luminosity of the catalogue is  = 42.5 ± 0.06 erg s−1 with a 16th − 84th percentile range of
  = 41.1−43.8 erg s−1. Whilst the median intrinsic absorption column density2 is log10(NH) = 22.7 ± 0.04 cm−2 with a 16th − 84th percentile range of log10(NH) = 21.8−23.5 cm−2. The Chandra images have a spatial resolution ∼1 arcsec, varying with photon energy and off-axis angle (e.g. Primini et al. 2011).
The source positions reported by Luo et al. (2017) are adjusted by ΔRA = +128 mas, ΔDec = −288 mas, as was derived by Lyu et al. (2024) for the Systematic Mid-infrared Instrument Legacy Extragalactic Survey (SMILES: PI: G. Rieke, #1207), to bring them into alignment with the GAIA reference co-ordinate system adopted for the JWST (and reprocessed HST) images (Gaia Collaboration 2021). We cross-matched the updated Chandra positions for the X-ray sources with the footprint of the MIDIS Survey, as is shown in Figure 1. For our analysis we required the X-ray source to be covered by at least the F560W filter in the MIDIS survey, ensuring that the observed-frame mid-infrared was sampled. This results in a sample of 31 X-ray sources, of which Luo et al. (2017) classify 14 as AGNs and 17 as galaxies. The label of ‘galaxy’ indicates that through the multi-wavelength analysis they carried out, no AGN component has been identified. However, using somewhat different criteria, Lyu et al. (2022), in their (pre-JWST) AGN catalogue, classify 23 of these X-ray sources as ‘AGNs’: all those previously so classified, plus 9 from the ‘galaxy’ category. In addition, the recent JWST/MIRI SMILES AGN survey (Lyu et al. 2024) yields one further AGN classification. Hence, the current tally is 24 AGNs and 7 galaxies. These AGN and galaxy assignments are listed in Appendix A. All 31 MIRI sources were previously detected at mid-IR (Spitzer) and near-IR/visible (HST) wavelengths; hence, their basic X-ray/IR properties have already been established (e.g. Luo et al. 2017; Lyu et al. 2022). Six of the highest-flux Chandra sources have X-ray spectra reported by Liu et al. (2017). These same six sources were also detected by XMM-Newton (Ranalli et al. 2013)3.
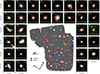 |
Fig. 1. MIDIS MIRI 5.6 μm image in the HUDF (centre) with |

For 97% (30/31) of the MIDIS sources that originate from the main CDF-S catalogue, we compare their properties to the overall CDF-S survey as presented above. We establish a median redshift of z = 1.3 ± 0.2 with a 16th − 84th percentile range of z = 0.65−2.49. The 30 sources have a median absorption-corrected X-ray luminosity of  = 42.1 ± 0.21 erg s−1 and column density of log10(NH) = 22.5 ± 0.3 cm−2, with a 16th − 84th percentile range of
  = 41.0−43.7 erg s−1 and log10(NH) = 21.7−23.2 cm−2, respectively. This indicates that there is not a substantial difference in these properties between the MIDIS sample and the parent catalogue. Comparing the number of X-ray sources and the sky area for MIDIS and the full CDF-S: MIDIS occupies ∼1% of the CDF-S, but has ∼3% of the X-ray sources; this can be understood in terms of MIDIS lying in a relatively high-sensitivity part of CFD-S.
3. Observational data
To analyse the AGN component of the X-ray detected galaxies in the MIDIS deep survey, we utilise deep multi-wavelength observations from public HST and JWST surveys in combination with those from the MIDIS survey of the HUDF, as we now describe.
3.1. MIDIS
A full description of the MIRI Deep Imaging Survey observations and data reduction is given in Östlin et al. (2025). In short, between December 2022 and December 2023, 52 hours of F560W and 10 hours of F1000W imaging were obtained in the HUDF. All observations were coherently reduced using a modified version of the official JWST pipeline4, version v1.12.3 (CRDS_CONTEXT = 1137), with additional routines to deal with cosmic-ray showers and background variations. As per the NIRCam and HST observations, each exposure was aligned to Gaia DR3, co-added, and drizzled to a final pixel scale of  5. In Figure 1 we show the final 5.6 μm mosaic from MIDIS, with a 5σ point-source depth of 28.6 mag (0.013 μJy) (Östlin et al. 2025), highlighting the unprecedented depth and resolution of the MIDIS observations. This is comparable to the depths of the JWST Advanced Deep Extragalactic Survey (JADES; PI: D. Eisenstein, #1180) NIRCam observations (Eisenstein et al. 2023) with a F444W 5σ point-source depth of 29.2, whilst being significantly deeper than the wide-area observations from SMILES with a 5σ point-source depth of 25.6 at 5.6 μm.
3.2. HST and JWST
We collated multi-wavelength JWST and HST observations in the HUDF from the DAWN JWST Archive (DJA)6, as is described in Gillman et al. (in prep.). Briefly, these observations cover the full observed-frame SED from 0.4−4.8 μm with the HST (F435W, F606W, F775W, F814W) and NIRCam (F090W, F115W, F150W, F200W, F210M, F335M, F277W, F356W, F410M, F444W, F460M, F480M) filters as well as the MIRI F770W filter at 7.7 μm. The observations, taken from a variety of public JWST surveys (e.g. JADES; Eisenstein et al. 2023, First Reionization Epoch Spectroscopically Complete Observations (FRESCO; PI: P. Oesch, #1895) Survey; Oesch et al. 2023, SMILES; Alberts et al. 2024) were coherently reduced using the GRIZLI software (Brammer et al. 2022), which builds upon the level-2 data products from the STScI archive7 and incorporates additional routines to deal with diagonal striping, cosmic rays, and stray light identified in some exposures (see Boogaard et al. 2024; Gillman et al. 2023, 2024). We aligned all images to the same World Coordinate System (WCS) reference using the Hubble Legacy Field (HLF) catalogue in Whitaker et al. (2019) based on Gaia DR3 (Gaia Collaboration 2021). The final mosaics were co-added and drizzled to a  pixel scale (Fruchter & Hook 2002) for all JWST and HST filters.
4. Analysis
To study the properties of the point-source (AGN) component of the X-ray detected sources in the MIDIS survey, we first identified the MIRI F560W and F1000W counterparts and characterised their multi-wavelength properties prior to employing a two-dimensional spatial decomposition routine to separate the AGN component and host galaxy.
4.1. MIRI counterparts
To identify the MIRI counterparts, we cross-matched the sample of 31 X-ray sources, with updated positions (see Section 2), with THE FARMER catalogue, as is presented in Gillman et al. (in prep.). THE FARMER catalogue, which utilises the deep F560W image from the MIDIS survey as the detection image, employs a model-based forced photometry approach to define the multi-wavelength fluxes of the detected sources from 0.4−10 μm.
To identify a MIRI counterpart to each of the 31 sources in the MIDIS field of view, we required a counterpart search radius of  . As is shown in Figure 1, we identified X-ray sources across the full extent of the MIDIS footprint, with a median X-ray to 5.6 μm offset of δr =
  ±
±  arcsec and a 16−84th percentile range of δr =
  . Comparing δr for each source with the corresponding X-ray positional error radius (1 standard deviation (≈68% confidence level), σr, Luo et al. 2017), we find a median of δr/σr = 0.7 ± 0.1 with only three, rather weak, sources (ID:698, ID:758, and ID:S-36) exceeding δr/σr ≈ 1.2. These same three sources also have relatively large (∼1 arcsec) counterpart-to-X-ray offsets in Luo et al. (2017). All 31 X-ray sources have clearly identified MIR counterparts, with a median FARMER model-based 5.6 μm magnitude of mF560W = 21.3 ± 0.3 with a 16th − 84th percentile range of mF560W = 20.3−22.4 and median 5.6 μm S/N = 1199 ± 264. The full properties of the sample are presented in Appendix A. In addition to the optical and infrared detections from HST and JWST, respectively, 11 sources (35%) of the sample are detected in the far-IR as part of the ALMA Spectroscopic Survey in the Hubble Ultra Deep Field (ASPECS; PI: F. Walter, Walter et al. 2016), as is highlighted in Appendix A. For a complete analysis of the ALMA-detected sources in the MIDIS survey, see Boogaard et al. (2024).
4.2. Redshifts
There are spectroscopic redshifts for all 31 sources in our sample. For 90 percent of them (28/31), spectroscopic redshifts are available from the far-IR surveys (e.g. Boogaard et al. 2020, 2024) as well as NIR optical studies such as the MUSE HUDF Survey (Bacon et al. 2023). For the remaining three sources without published spectroscopic redshifts, we utilised the public spectroscopic observations from FRESCO (Oesch et al. 2023) that target the MIDIS field. Following the same procedure as Boogaard et al. (2024), we extracted spectroscopic redshifts for ID:797 at z = 2.695 and ID:805 at z = 2.698 based off the detected nebula line emission (e.g. Hα, [OIII]). For the remaining source, ID:695, which is not covered in the FRESCO Survey, we searched the Next Generation Deep Extragalactic Exploratory Public (NGDEEP, PI: S. Finkelstein, #2079) Survey (Bagley et al. 2024). Again adopting the procedure of Boogaard et al. (2024), we identified a spectroscopic redshift of z = 1.56 for the X-ray source ID:694.
Our sample has a median redshift of z = 1.22 ± 0.19 with a 16th − 84th percentile range of z = 0.62−2.48. The redshifts of the full sample are presented in Appendix A. For 12 sources we identify a different spectroscopic redshift to the photometric redshift used by Luo et al. (2017). We therefore updated the redshift and intrinsic X-ray luminosity for the sources in our sample, with a median ratio of  = 1.04 ± 0.05. The updated X-ray luminosities and spectroscopic redshifts for the full sample are reported in Appendix A, and in Figure 2 we plot the 0.5−7 keV absorption-corrected X-ray luminosity (LXc) for the 31 X-ray sources in the MIDIS survey as a function of their redshift, showing the comparison to the full sample presented in Luo et al. (2017)8.
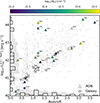 |
Fig. 2. Absorption corrected X-ray (0.5−7 keV) luminosity as a function of redshift for the 31 X-ray sources in the MIDIS survey coloured by column density (NH). Where appropriate the X-ray luminosity has been updated to reflect the spectroscopic redshift, see Section 4.2. In the background we show the X-ray emitting sources identified by Luo et al. (2017) in the 7 Ms survey. We show the distribution for the MIDIS sources (black histogram) and 7 Ms sources (grey histogram, scaled down by a factor 10) on each axis. A clear trend of increasing X-ray luminosity with redshift is apparent, as is expected for a flux-limited sample. |
4.3. Morphological analysis
In Figure 1 we show the MIRI F560W/F770W/F1000W false colour images for the X-ray sources, highlighting the diverse range of morphology in the sample from compact, point-source red objects to extended, disc-like systems. These MIRI mid-infrared observations sample the galaxy emission at rest-frame > 1 μm, providing insights into the structure and morphology of the continuum emission.
We visually assessed the morphologies of the X-ray sources, in addition to both a non-parametric and parametric analysis of the MIRI F560W and F1000W observations, to quantify their rest-frame NIR morphology. We excluded the HST and NIRCam observations from our morphological analysis because we are interested in identifying the AGN component of the galaxies, which becomes more prominent at wavelengths greater than rest-frame 1 μm. The analysis of the JWST imaging employs  cutouts of each source with pixel scales of
  per pixel9. The cutout in each filter is centred on the source detected in the MIDIS 5.6 μm observation. We used PHOTUTILS (Bradley et al. 2022) to model (and remove) the background level in each cutout as well as to quantify the root-mean-square (rms) noise. In the following sections ‘cutout’ refers to these
  , background subtracted images that are used in the morphological analysis that follows.
Before measuring the galaxies’ morphology, we first defined the point spread function (PSF) for each of the JWST bands. We adopted the PSFs used in Gillman et al. (in prep.) that were used to build THE FARMER catalogue. For the F560W band, this includes an empirical PSF made from stacked stars that accurately models the extended cross-form pattern of the F560W PSF, whilst for the MIRI F1000W band the PSF is generated from WEBBPSF (Perrin et al. 2014). For full details see Gillman et al. (in prep.).
4.3.1. Visual morphology
To aid the visual classification, we also generated two colour maps for each galaxy, an example of which is shown in Figure 3. The colour maps contrast the NIRCam F210M and F480M filters, which sample the rest-frame optical emission of the galaxies, with the MIRI F560W observation, which samples the rest-frame NIR emission. In this way, by contrasting the rest-frame optical and NIR emission any unresolved AGN-heated dust emission that begins to dominate over the stellar emission in the NIR clearly stands out (e.g. Martini et al. 2003). The colour maps of the full sample are shown in Appendix D.
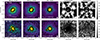 |
Fig. 3. JWST multi-wavelength imaging and colour maps for two examples of the X-ray sources in our sample. The full sample is shown in Appendix D. For each galaxy, we show, and contour, a 3-arcsec cutout in the NIRCam F210M band (a), the NIRCam F480M band (b) and the MIRI F560W band (c). We label the galaxy’s ID given by Luo et al. (2017), measured flux in each band, and spectroscopic redshift. We also indicate the FWHM of the PSF in each band by the white circle in the lower right corner. The F210M/F560W (d) and F480M/F560W (e) colour maps are shown for each source, highlighting the presence of any AGN (point source) component at longer (NIR) wavelengths. |
The visual classification of all 31 target galaxies utilising the MIRI F560W and F1000W cutouts as well as corresponding colour maps was carried out by six team members (and co-authors). The initial classifications were assigned independently, and a final, merged outcome was produced from an interactive discussion. Where deemed necessary, a more detailed inspection was done with the F560W and F1000W images displayed using DS9 and interactively optimising the greyscale or colour scale to view the faintest or brightest regions of an object.
For ease of comparison with similar studies, we adopted the classification scheme used by Kartaltepe et al. (2023) in studying galaxy structure and morphology at z = 3−9 from the Cosmic Evolution Early Release Science (CEERS: PI: S. Finkelstein, #1345) programme. Hence we allowed for recognition of up to four categories of surface-brightness morphology: disc, spheroid, irregular, and point-source/unresolved. The first three are collectively referred to as ‘extended’. Each galaxy can exhibit multiple extended-morphology classes. We further indicate whether each source shows any signs of morphological interaction, although we note this is purely line-of-sight interaction and does not consider the redshift of any potential companion. The main aim of this exercise is to identify the presence of (i) point-source components, and (ii) extended emission components, for comparison with the morphological results from the parametric and non-parametric methods. We caution that there is some degree of subjectivity and uncertainty concerning the visual classification into the three individual extended-emission categories, as is discussed in Kartaltepe et al. (2023); nevertheless, we consider that they form a useful basis for the cross-comparisons.
4.3.2. Non-parametric modelling
Next, we adopted a non-parametric approach to quantify the morphology of the X-ray-selected galaxies. This approach invokes no assumptions on the underlying structure of the galaxy’s light distribution, and thus highlights the unique properties of each source. Prior to quantifying the morphology, we first smoothed the source segmentation map generated from THE FARMER using the binary dilation routine in PHOTUTILS. Then, excluding this segmented region, we masked the remaining sources in the cutout, down to a 1σ isophote. This ensures full masking of any contaminants (spurious or otherwise). We ran STATMORPH10 (Rodriguez-Gomez et al. 2019) on the masked cutouts in the 5.6 μm and 10 μm bands using the same segmentation maps and PSFs as for the THE FARMER catalogue (see Section 4.1).
STATMORPH measures the concentration, asymmetry, and clumpiness (C, A, S; Abraham et al. 2003; Lotz et al. 2008) parameters that quantify how concentrated, asymmetrical, and clumpy the galaxies’ surface brightness profiles are, with higher values indicating more concentrated, more asymmetric, or clumpier light profiles, respectively. In addition, the Gini and M20 parameters were also derived (for full definitions see Lotz et al. 2004; Snyder et al. 2015). Briefly, the Gini parameter defines the pixel distribution of the galaxy’s light, where G = 1 corresponds to all of the light concentrated in one pixel, whilst G = 0 indicates each pixel contributes equally. The M20 parameter measures the second moment of the brightest 20 percent of pixels in the galaxy. This is normalised by the total moment for all pixels. Highly negative values indicate a high concentration of light, not necessarily at the centre of the galaxy.
4.3.3. Parametric modelling
Finally, to quantify both the parametric morphological profiles of the galaxies and the deviations from these, we used the GALFITM code (Häußler et al. 2013). GALFITM is a Python-wrapper for GALFIT (Peng et al. 2010), that allows multi-component parametric models to be fit to a galaxy’s multi-wavelength light distribution. For our analysis we fitted each band independently, allowing us to constrain the intrinsic wavelength dependence of each galaxy’s morphology. We further simultaneously modelled, with a single Sérsic model (Sérsic 1963), all sources within  of the X-ray source, as identified in the THE FARMER segmentation map (see Section 4.1) .
Following a similar approach to recent JWST studies of AGN morphology (e.g. Silverman et al. 2023; Tanaka et al. 2024), we fitted two different models to the cutout in each band to determine the presence of a point-source component to each galaxy’s light profile. First, we fitted a single free Sérsic model with seven free parameters, the centroid (x, y), the magnitude, the Sérsic index (n), the half-light radius, the position angle, and the axis ratio11. We then fitted a free Sérsic model plus PSF model with the PSF model defined from the input PSF and parametrised with a position angle, magnitude, and centroid (x, y), with 11 free parameters,. An example of the parametric modelling of the galaxies is shown in Figure 4, with the full sample shown in Appendix E.
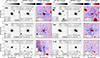 |
Fig. 4. Examples of the rest-frame 2 μm morphological analysis for six X-ray sources in our sample, highlighting the diverse range of morphology in the sample. For each source, we show a 10-arcsecond cutout, best-fit Sérsic plus PSF parametric model and normalised residuals (residual/σ). We label the source ID, MIRI filter, non-parametric (Gini, M20, C, A, S) and parametric ( |

To evaluate the goodness of fit of each of the models, we employed two metrics. First, we quantified the significance of the residuals to each model in each band using the residual flux fraction (RFF), as defined in Hoyos et al. (2011, 2012),
where the sum is performed over all pixels within 2.5 times the Kron radius as derived in the F560W image.  is the absolute value of pixel i, j’s residuals to the model Sérsic fit, whilst ∑i, j ∈ AIi, j indicates the total flux measured in the source as defined in Section 4.1. The 0.8 factor, multiplied by the sum over the background rms of the region (σBkg i, j), ensures that a blank image with a constant variance has an RFF = 0.0 (see Hoyos et al. 2012 for details). Finally, we calculated the reduced chi-squared of each model, which is defined as

where  is the sum of the residual image, Nd is the number of data points, and Nvarys is the number of variable parameters. The model with the
  close to unity is preferred.
4.4. Aperture photometry of point-source components
As an independent verification of the point-source fluxes derived from the GALFITM parametric modelling, which assumes the point-source component is well modelled by the PSF model, we performed aperture photometry on the target galaxies in the F560W image and their free single Sérsic model residual images. We expect the GALFITM-modelled point source fluxes to be larger than those derived from the residuals, yet smaller than those derived from the input images that contain contributions from the host galaxy.
We used SEP (Barbary et al. 2016), a Pythonic version of SOURCE EXTRACTOR (Bertin & Arnouts 1996), to perform aperture photometry in  radius circular apertures centred on the MIRI source. We corrected the aperture fluxes to ‘total’ following the aperture corrections as reported by STScI12. For the residuals, on average, we find
  = 1.04 ± 0.01. On the images themselves, we derived a median value of
  = 0.98 ± 0.02, highlighting the contributions from the host galaxy to the point-source emission.
As a final validation of the point-source fluxes, we re-ran the GALFIT modelling using the MIRI ePSF models from Libralato et al. (2024). We derived a field-of-view-varying ePSF model following the same procedure as for the empirical PSF (see Boogaard et al. 2024 for full details). For the 31 X-ray sources, we derived a lower point-source flux when using the ePSF models (fePSF/fempircal = 0.70 ± 0.03), which we suspect is driven by the lower noise level in the ePSF model and brighter cruciform pattern at large radii when compared to the empirical PSF. We note, however, that the choice of PSF does not alter the results presented in the forthcoming sections.
5. Results and discussion
From our sample of 31 X-ray detected galaxies, we have 24 AGNs or AGN candidates and 7 star-forming galaxies as classified from previous literature studies (e.g., Luo et al. 2017; Lyu et al. 2022, 2024) with a median redshift of z = 1.22 ± 0.19 and a 16th − 84th percentile range z = 0.62−2.48. The AGN sources are identified through a multi-wavelength analysis that encompasses the objects’ X-ray, radio, and infrared properties. One such selection is the mid-infrared colour selection, which isolates the potential AGN contribution to the NIR emission (e.g. Lyu et al. 2024).
In Figure 5a, we show the source integrated F444W − F770W versus F356W − F560W colour-colour diagram, which mimics the IRAC colour selection commonly used to isolate AGN sources (Donley et al. 2012; Kirkpatrick et al. 2017), as is indicated by the dashed red and orange region. Whilst a small fraction (7/31) of the X-ray detected sources fall in the AGN parameter space, isolating the most luminous X-ray sources in our sample, the majority do not. It is well known that this colour selection is not robust against obscured or high-redshift AGNs that can have NIR colours that mimic star-forming galaxies due to the dominance of stellar emission at these wavelengths in these systems (e.g. Cardamone et al. 2008; Donley et al. 2012; Mateos et al. 2015; Kirkpatrick et al. 2017; Lyu et al. 2022).
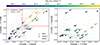 |
Fig. 5. Near-IR colour properties of the 31 X-ray sources coloured by X-ray luminosity. Grey points are star-forming galaxies in the MIDIS field of view above z > 0.5. We show the F444W − F770W colour versus F356W − F560W colour (a), highlighting the NIR colour selected AGN region proposed by Kirkpatrick et al. (2017) (dashed red line) and Donley et al. (2012) (dashed orange line). In panel b we plot the MIRI colours, F560W − F770W versus F770W − F1000W. The three X-ray emitting galaxies with F770W − F1000W > 1.5 have a colour likely driven by the presence of the 6.2 μm PAH feature in the F1000W filter with redshifts between z = 0.46−0.67 as has been demonstrated by Langeroodi & Hjorth (2023). |
In Figure 5b, we show the MIRI F560W, F770W, F1000W colour–colour diagram, highlighting the comparable brightness across the three filters. In three of the X-ray sources classified as star-forming galaxies, we identify excess F1000W emission compared to F770W with an F770W − F1000W > 1.5. These three galaxies (ID:724, ID:799, and ID:S-36) have redshifts between z = 0.46−0.67, making the F1000W filter sensitive to the 6.2 μm feature indicating the presence of star formation activity. We suspect that this drives their excess F1000W emission, as has been highlighted in recent studies of PAHs using MIRI (e.g. Langeroodi & Hjorth 2023; Shivaei et al. 2024). This excess is not seen in the AGNs at similar redshifts due to the presence of non-stellar emission dominating over the PAH features.
Visual classification statistics of the 31 X-ray emitting galaxies detected in the MIDIS survey.
5.1. Visual morphology
A summary of the visual classifications is given in Table 1, with a detailed breakdown of each source given in Appendix C. For a point-source component, we identify 8 objects (6 AGNs and 2 galaxies) where we consider it is likely present, 14 (11 and 3) where it is definitely present, and of these latter, 10 (9 and 1) where the characteristic pattern of the instrumental PSF (Perrin et al. 2014) can be seen. For the nine cases in which we do not report the presence of a point source, this should be taken as ‘absence of evidence’ rather than ‘evidence of absence’, as complexity and contrast in a galaxy’s emission morphology can limit the visual classification process. For extended emission, there are 10 objects (8 AGNs and 2 galaxies) where we consider it is likely present, and 17 (13 and 4) where it is definitely visible. There are 17 (12 and 5) objects with possible multiple extended component types i.e. disc, spheroid, or irregular, and 14 (11 and 3) where the morphology indicates a possible interacting system.
5.2. Morphological modelling
To evaluate the presence of a point-source component by modelling the surface brightness profiles of the X-ray emitting galaxies, we assessed the relative goodness of fit of parametric models using the reduced chi-squared and RFF parameters. For each galaxy we calculated Δχ2 =  and ΔRFF = RFFSingle/RFFSingle + PSF. Defined in this way, a galaxy with Δχ2 > 0 and ΔRFF > 1 indicates that its morphology is better modelled with a single Sérsic plus PSF model.
On average, for the 31 galaxies in the F560W filter we identify an improved reduced chi-squared when fitting a Sérsic plus PSF model with a median value of  −
−  = 3.35 ± 1.12 (see Appendix F). We further establish an average reduction in the amplitude of residuals for the two component model with ΔRFF = 1.28 ± 0.08. In two sources, ID:695 and ID:709, we identify an increase in the residuals when fitting two components. Upon visual inspection (see Appendix C) the morphological measurements of both galaxies are clearly impacted by a companion, possibly merging, galaxy.
In Figure 6 we show the fractional point-source flux density in the F560W filter, ff , as a function of the Gini parameter (GiniF560W), where ffPSF is the point-source flux density relative to the total (Sérsic + PSF) flux density in the GALFITM model. The sources are coloured by the visual classification of point source presence (PSP) as defined in Sect. 4.3.1. We note that there is overall a positive correlation (as might be expected) between Gini and ffPSF, albeit with a broad dispersion, indicating good agreement between the different morphological parameters. Those AGNs with no visual PSP have ffPSF ≲ 0.2, and the same is the case for the sources classified as galaxies, with one exception (ffPSF ∼ 0.55). Conversely, it appears that point-source components with ffPSF ≳ 0.25 can be reliably discerned by GALFITM. All sources with Gini ≳ 0.5 have the PSF pattern visible.
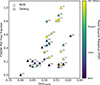 |
Fig. 6. Example comparison of the three morphological analysis methods, for the MIRI/F560W waveband, for each source: Gini (STATMORPH) vs fractional point-source flux density, ffPSF (GALFITM), with the visual classifications of point-source presence indicated by colour-coding of each symbol (purple – no point-source identified; blue – likely; green – yes; yellow – yes, with a visible PSF characteristic diffraction pattern). The source classification, ‘AGN’ or ‘galaxy’, is indicated by the symbol shape: a triangle and a star, respectively. The numbers by each symbol give the X-ray source reference (XID, Luo et al. 2017). |
A recent study by Bonaventura et al. (2024), which analysed the NIR morphology of a sample of mid-infrared selected AGNs, identified a 3σ correlation between the observed-frame 1.5 μm asymmetry and the column density of the sources, establishing that mergers are more common amongst high-redshift obscured AGNs. For the 24 AGNs in our MIDIS sample of X-ray selected sources, we find no strong correlation between the 5.6 μm asymmetry and column density, with a median asymmetry of A5.6 μm = 0.06 ± 0.02, below the ‘mild’ disturbance threshold of A = 0.1 (see Bonaventura et al. 2024). We note that whilst we find no correlation between asymmetry and column density in our sample, this is not a direct comparison given the difference in rest-frame wavelength probed between the two studies. Furthermore, our sample is X-ray selected, whilst the Bonaventura et al. (2024) AGN sample includes (X-ray undetected) infrared-selected AGNs that from previous HST studies have been shown to exhibit a higher fraction of mergers (e.g. Kocevski et al. 2015; Donley et al. 2018; Ji et al. 2022).
5.3. Comparison with X-ray luminosity
Given the broad range of redshift of our sample from z = 0.2−3.6, the rest-frame wavelength probed by the MIDIS 5.6 μm (10 μm) observations varies from 4.7 μm (8.3 μm) to 1.2 μm (2.1 μm). To align the observations to a common rest-frame wavelength, we selected the observation that samples closest to the rest-frame 2 μm emission. At 2 μm the emission is mostly unaffected by recent star formation and highlights any AGN component if present. Given the redshift range detailed in Appendix A, for 84% (26/31) of the sources we select the F560W filter, for 6% (2/31) we use the F1000W filter, and for the remaining 10% (3/31) we use the F770W observations from the MIRI-SMILES survey as detailed in Section 3. In doing so, on average we sample the rest-frame 2.54 ± 0.16 μm, emission with a 16th − 84th percentile range of 1.94−3.47 μm.
To convert the point-source luminosity of the galaxies, derived from GALFITM, to an intrinsic rest-frame luminosity we first converted the observed-frame fluxes to luminosities using the luminosity distance of each source. We then applied a K correction of the form (1 + z) following the prescriptions of Hogg (1999) to derive the rest-frame 2 μm luminosity. Finally we scaled the luminosities by the rest-frame frequency of the observations to give final units of erg s−1. In Figure 7a, we correlate the relative contribution of the point source component to the total 2 μm luminosity of each source, with the absorption-corrected intrinsic 0.5−7.0 keV X-ray luminosity, identifying a correlation with a Spearman rank coefficient of rs = 0.48. For 13/31 (42%) of the sources, we find the relative point-source contribution to the total luminosity to be less than 20%. These sources exhibit no correlation with X-ray luminosity and represent the fainter X-ray sources in our sample with log10(LXc) ≤ 43 erg s−1. For sources with a point-source contribution above 20%, we identify a stronger correlation with X-ray luminosity, but no dependence on the column density (NH), which we adopt from Luo et al. (2017).
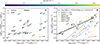 |
Fig. 7. Relation between the ratio of rest-frame 2 μm point source (PS) luminosity to total (PSF + Sérsic) 2 μm luminosity (a) and PS luminosity (b) as a function of the 0.5−7.0 keV X-ray luminosity. In each panel we show the Spearman rank correlation coefficient (rs) for the relations, a running median (grey squares) in bins of 1 dex in X-ray luminosity. We exclude sources in panel b with a PS to total luminosity ratio of less than 20%. We further show the one-to-one relation (dashed black line) and overlay nearby (z ∼ 0.01) AGNs from Burtscher et al. (2015), as well as the 6 μm – X-ray luminosity relations from Mateos et al. (2015) for z ≃ 0.2−2.8 AGN and higher-redshift quasars from Chen et al. (2017), as well as the MIRI-SMILES X-ray sources from Lyu et al. (2024). Whilst we identify a strong (r = 0.73) correlation between NIR point-source luminosity and X-ray luminosity in our samples, at log10(LXc) ≤ 43 erg s−1, we identify higher 2 μm PS luminosities than other studies, with no strong correlation with column density (NH). |
Of the galaxies in our sample, 5/7 (71%) have a point source to total luminosity ratio below 40%, with one galaxy (ID:695) with the lowest X-ray luminosity in our sample (log10(LXc) = 40.23 erg s−1) having almost zero contribution from a point source in the mid-infrared (< 0.01%), indicating that the X-ray emission may arise from X-ray binaries or merger-driven activity in the extended (non-nuclear) regions of the galaxy (e.g. Gao et al. 2003; Barrows et al. 2024). In contrast, two X-ray sources classified as galaxies (ID:694 and ID:690) have very high levels of point-source contribution: 79% and 57%, respectively. Both of these galaxies are also visually classified as possibly undergoing interactions or mergers, which makes the morphological modelling more uncertain. Furthermore both galaxies have small half-light radii (Rh <  ), comparable to the PSF size of the MIRI observations, making it challenging to resolve the presence of a host galaxy, with both sources remaining point-source like even at rest-frame optical wavelengths (λ < 0.4 μm). As is noted by Luo et al. (2017), some of the X-ray sources classified as galaxies in their analysis might host low-luminosity or heavily obscured AGNs that remain undetected based on the six selection criteria used for AGN identification (see Luo et al. 2017 for full details). Looking at the spectral properties of ID:694 and ID:690 from the NGDEEP prism spectra (see Section 4), there is no clear evidence of AGN activity, i.e broad-line emission.
In Figure 7b we correlate the 2 μm point-source luminosity of the sources with their X-ray luminosity. We exclude sources with a point-source to total fraction of less than 20% (13 sources) that show no correlation with X-ray luminosity, as is identified in Figure 7a. We identify a strong correlation with a Spearman rank coefficient of rs = 0.73, although no strong dependence on the column density as derived by Luo et al. (2017). We derive a running median in bins of 1 dex in X-ray luminosity, as is shown by the grey squares in Figure 7b, which we quantify further using a linear orthogonal distance regression (ODR) fit of the form

establishing α = 0.55 ± 0.04 and β = 20.10 ± 1.70.
We compare our relation between NIR point-source luminosity and X-ray luminosity to other literature samples of quasars and AGNs. Specifically we plot the sample of local (z ∼ 0.01) Seyfert 1 (blue triangles) and 2 (red triangles) AGN from Burtscher et al. (2015). We converted the 2−10 keV luminosities reported in Burtscher et al. (2015), to the 0.5−7 keV energy band using a scaling factor of 0.73 derived from WEBPIMMS13, assuming a (negative) power-law spectrum (i.e. F(E) ∝ E−γ) with a photon index (γ) of 1.8 and a (galactic) column density absorption of NH = 9 × 1019 cm−2 following Luo et al. (2017)14. We note that the NIR luminosity reported in Burtscher et al. (2015) was derived from a combination of the radial CO equivalent-width profile and spectral decomposition, and thus might not be directly comparable to our morphological decomposition.
In addition to the local AGNs, we compare to the relations derived by Mateos et al. (2015) and Chen et al. (2017), for X-ray AGNs and quasars across a broad range of redshifts (z ≃ 0.2−2.8). Both these studies report the relation between the galaxy integrated rest-frame mid-infrared (6 μm) and 2−10 keV X-ray luminosity, which we converted to the 0.5−7 keV energy band using the same scaling as for the Burtscher et al. (2015) sample. We further included the comparison to the recent study by Lyu et al. (2024) of the 217 AGNs reported in the MIRI SMILES survey in GOODS-S. In Figure 7b we plot the X-ray detected MIRI-SMILES AGNs (orange triangles) and galaxies (orange stars), again converting to the 0.5−7 keV energy band. All three of these samples are derived at longer rest-frame wavelengths than 2 μm. In the absence of strong star formation activity, at 6 μm for a power-law spectrum any AGN component of the X-ray source will dominate over the stellar emission of the host galaxy, removing the need for any decomposition of fluxes at this wavelength. Given that the majority of the sources (20/31) are undetected in the ALMA ASPECS survey (Boogaard et al. 2019, 2020), we can infer this is the case for the majority of our sample. Thus we expect the rest-frame 6 μm luminosity to be larger than the 2 μm luminosity in our sample.
In Figure 7b we see that, whilst the high-X-ray-luminosity (log10(LX) ≥ 43.5 erg s−1) MIDIS sources are consistent with other studies, the lower-luminosity sources are offset to higher NIR luminosities, compared to all pre-JWST surveys. However the low-X-ray-luminosity MIDIS sources are comparable to the 6 μm – X-ray luminosity relation identified in the MIRI-SMILES survey, with NIR luminosities more than an order of magnitude higher than what was expected from the Burtscher et al. (2015) sample. Whilst the low-X-ray-luminosity MIDIS sources align with the MIRI-SMILES galaxies and AGNs from Lyu et al. (2024), as was noted before this is not a direct comparison to the SMILES sample due to the offset in the rest-frame wavelength probed by the infrared observations.
To understand the origin of this offset, we investigated a number of different scenarios for the X-ray sources classified as galaxies and AGNs. Firstly, the origin of the NIR point-source emission might come from nuclear starburst activity. For instance, there are known local nuclear starbursts such as Arp 220, which has an X-ray luminosity of ≈1040 erg s−1 and a rest-frame 2.2 μm point-source luminosity of ≈1043 erg s−1 (e.g. Scoville et al. 2000; Iwasawa et al. 2011). Of the three most offset sources in this regime, two (ID:799 and ID:724) are classified as galaxies, indicating that the AGN contribution is minimal or currently undetected. As is also highlighted in Figure 5, these two X-ray sources have redshifts of z ∼ 0.6, placing the 3.3 μm PAH feature in the F560W filter. Hence this may result in an excess in this filter, boosting the NIR luminosity in the presence of strong star formation activity (e.g. Langeroodi & Hjorth 2023). Furthermore, ID:724 has a reported 1-mm flux of S1.2 mm = 34 ± 10 μJy from the ASPECS survey (Aravena et al. 2020; Boogaard et al. 2024), further indicating the presence of intense star formation activity. Both ID:799 and the AGN with the largest offset (ID:727) have featureless NGDEEP prism spectra (see Section 4), with no clear signs of AGN activity in the emission lines or continuum shape. Meanwhile ID:724, has a clear detection of a broad Paβ line, potentially indicating the presence of AGN activity in this source previously classified as a galaxy. We note, however, that it is difficult to definitively determine the presence of AGN activity in the prism spectrum given the low (∼2000 km s−1) resolution.
Another possible reason for the large offset at low X-ray luminosities might be that the intrinsic X-ray luminosity of these sources could be underestimated if their column density is underestimated. We can calculate the increase in column density required for the least luminous X-ray sources, with log10(LXc) ∼ 41.0 erg s−1, to be consistent with the Burtscher et al. (2015) sample. For example, the AGN source ID:727 has a power-law index of γ = 1.65 and a column density of NH = 2.1 × 1021 cm−2, as was reported by Luo et al. (2017). Using WEBPIMMS, we estimate that a column density of NH ∼ 3 × 1024 cm−2 would be needed to yield the required absorption factor of ∼30 to be applied to the observed X-ray luminosity. We note that this scenario may not be physically reasonable, given that the source has a significant detection in the Chandra ‘soft’ band (0.5−2 keV; Luo et al. 2017). The presence of a soft-excess would alleviate the need for such an extreme column density. However based on the effective power-law slope given in Luo et al. (2017), none of eight sources with log10(LXc) < 42.0 erg s−1 show indications of a soft excess with γ ≤ 1.8, after taking into account uncertainties. In the next luminosity bin at log10(LXc) ∼ 42.04 erg s−1, the required column density to enhance the intrinsic X-ray luminosity is not so extreme, with the uncertainty on the median bin making it nearly consistent with the relations from Mateos et al. (2015) and Chen et al. (2017).
We note that the excess identified at low X-ray luminosity is unlikely to be driven by just one of these scenarios, and is more likely a relative combination of all processes that is driven by the unique evolutionary path of each galaxy. This study of the X-ray sources within the MIDIS observations has demonstrated the power of deep, high-resolution, mid-IR imaging with MIRI, whilst highlighting the complex nature of X-ray sources in the distant Universe and the need for the upcoming MIDIS-Red observations at 7.7 μm and 10 μm with an equivalent 5σ point source depth that will unveil the true nature of X-ray sources and AGNs in the HUDF.
6. Conclusions
The unprecedented mid-IR sensitivity and imaging resolution of MIRI, and the great depth of the MIDIS survey, allow in many cases for the direct characterisation of point-like (i.e. unresolved) components in high-redshift galaxy images, at rest-frame NIR wavelengths.
-
Our sample consists of the 31 X-ray sources (CDF-S, Luo et al. 2017) in the MIRI Deep Imaging Survey (MIDIS) of the HUDF, using two filters, F560W and F1000W.
-
From the measured mid-IR emission, the sources classified as galaxies do not appear to have clearly distinct properties, though we note that three of them show high colour values of F770W to F1000W, likely driven by the presence of the 6.2 μm PAH feature in the F1000W filter with redshifts between z = 0.46 and 0.67 (Fig. 5b).
-
We employed three methods to examine the presence of rest-frame mid-infrared unresolved emission, which is assumed to arise in AGN-heated hot dust. Two are based on morphological modelling techniques (parametric and non-parametric), and one on visual inspection. There is broad agreement between these methods (Fig. 6).
-
At least 70% of the sources show unresolved emission in the MIRI images, with the unresolved-to-total flux fraction ranging from ∼0.2 to ∼0.9. About half of the objects in our sample have published X-ray column densities (Luo et al. 2017). We find no strong correlation between the column densities and the ratio of the point-source component to the total 2-micron rest-frame luminosity. For an obscured AGN that has a high column density, we might have expected a smaller point-source contribution.
-
In common with previous studies, we confirm a strong correlation between the 2-micron (rest-frame) point-source luminosity and the X-ray luminosity, with a Spearman rank coefficient of rs = 0.73 (Fig. 7). We establish a shallower slope than previous studies with α = 0.55 ± 0.04, giving rise to an excess rest-frame NIR 2 μm luminosity below log10(LXc) = 43.5 erg s−1, comparable to that derived by Lyu et al. (2024) at 6 μm.
-
We speculate this offset to be driven by a combination of compact galaxy size, nuclear starburst activity, Compton-thick AGNs, and 3.3 μm PAH emission acting to enhance the NIR point source emission.
The current MIDIS data are being augmented in 2024 and 2025 by deep imaging at longer wavelengths (F770W and F1000W) with programme id. 6511, PI G. Östlin, facilitating the identification of obscured AGNs at redshifts of ∼3 − 4.
Data availability
Appendices D and E are available via the Zenodo platform https://zenodo.org/records/17093764
Downloaded from the online CDS VizieR catalogue server: https://vizier.cds.unistra.fr/viz-bin/VizieR-3?-source=J/ApJS/228/2
For sources where Luo et al. (2017) report a column density.
A seventh, low-significance, source in the XMM-Newton catalogue of Ranalli et al. (2013) was noted by them as ‘probably spurious’, and we find no reasonable MIRI-F560W counterpart.
We note this pixel scale is different to that presented in Östlin et al. (2025) to be consistent with the ancillary observations used in our analysis.
In principle, for sources with an updated redshift and significant intrinsic absorption indicated by an effective power-law index γ < 1.8, the intrinsic column density (NH) should be re-evaluated, with the procedure of Luo et al. (2017) (Sect. 4.4), and incorporated in revising the intrinsic X-ray luminosity (LXc). However, we find that there is no significant change (< 10%) in NH for the most extreme case in our sample XID:754 (redshift change from z = 0.66 to z = 0.32).

Acknowledgments
The observations analysed in this work are made with the NASA/ESA/CSA James Webb Space Telescope (DOI: 10.17909/z7p0-8481). SG acknowledges financial support from the Villum Young Investigator grants 37440 and 13160 and the Cosmic Dawn Center (DAWN), funded by the Danish National Research Foundation (DNRF) under grant No. 140. JPP and TVT acknowledge financial support from the UK Science and Technology Facilities Council, and the UK Space Agency. JH and DL were supported by research grants (VIL16599, VIL54489) from VILLUM FONDEN. AE and FP acknowledge support through the German Space Agency DLR 50OS1501 and DLR 50OS2001 from 2015 to 2023. AAH acknowledges support from grant PID2021-124665NB-I00 funded by MCIN/AEI/10.13039/501100011033 and by ERDF ‘A way of making Europe’. ACG acknowledges support by grant PIB2021-127718NB-100 from the Spanish Ministry of Science and Innovation/State Agency of Research MCIN/AEI/10.13039/501100011033, and by JWST contract B0215/JWST-GO-02926. JAM acknowledges support by grant PIB2021-127718NB-100 funded by MCIN/AEI/10.13039/501100011033 and by ERDF ‘A way of making Europe’. GÖ, AB and JM acknowledge support from the Swedish National Space Administration (SNSA). SEIB is supported by the Deutsche Forschungsgemeinschaft (DFG) under Emmy Noether grant number BO 5771/1-1. PGP-G acknowledges support from grant PID2022-139567NB-I00 funded by Spanish Ministerio de Ciencia, Innovación y Universidades MICIU/AEI/10.13039/501100011033, and the European Union FEDER program Una manera de hacer Europa. Cloud-based data processing and file storage for this work are provided by the AWS Cloud Credits for Research program. The data products presented herein were retrieved from the Dawn JWST Archive (DJA). DJA is an initiative of the Cosmic Dawn Center, which is funded by the Danish National Research Foundation under grant No. 140. This research has made use of the SIMBAD database, the VizieR catalogue access tool, and the Aladin sky atlas, developed by and operated at CDS, Strasbourg, France. This research has made use of the Astrophysics Data System (ADS), funded by NASA under Cooperative Agreement 80NSSC21M00561. This work made use of the following facilities: ALMA, Chandra, HST, JWST, XMM-Newton This work made use of the following open-source software: DS9 (https://ds9.si.edu/doc/user/index.html), jwst science calibration pipeline (https://jwst-docs.stsci.edu/jwst-science-calibration-pipeline#gsc.tab=0), cds [aladin, simbad, vizier] (https://cds.unistra.fr/), ads (https://ui.adsabs.harvard.edu/), Astropy (Astropy Collaboration 2013), Photutils (Bradley et al. 2022), Source Extractor (Bertin & Arnouts 1996), SEP (Barbary et al. 2016), Eazy-py (Brammer & Matharu 2021), GriZli (Brammer et al. 2022), GalfitM (Häußler et al. 2013), Statmorph (Rodriguez-Gomez et al. 2019), Topcat (Taylor 2005), STILTS (Taylor 2006), THE FARMER (Weaver et al. 2023), WebbPSF (Perrin et al. 2014).
References
- Abraham, R. G., van den Bergh, S., & Nair, P. 2003, ApJ, 588, 218 [NASA ADS] [CrossRef] [Google Scholar]
- Alberts, S., Lyu, J., Shivaei, I., et al. 2024, ApJ, 976, 224 [Google Scholar]
- Alonso-Herrero, A., Ward, M. J., & Kotilainen, J. K. 1997, MNRAS, 288, 977 [NASA ADS] [Google Scholar]
- Aravena, M., Boogaard, L., Gónzalez-López, J., et al. 2020, ApJ, 901, 79 [NASA ADS] [CrossRef] [Google Scholar]
- Asmus, D., Gandhi, P., Hönig, S. F., Smette, A., & Duschl, W. J. 2015, MNRAS, 454, 766 [NASA ADS] [CrossRef] [Google Scholar]
- Astropy Collaboration (Robitaille, T. P., et al.) 2013, A&A, 558, A33 [NASA ADS] [CrossRef] [EDP Sciences] [Google Scholar]
- Bacon, R., Brinchmann, J., Conseil, S., et al. 2023, A&A, 670, A4 [NASA ADS] [CrossRef] [EDP Sciences] [Google Scholar]
- Bagley, M. B., Pirzkal, N., Finkelstein, S. L., et al. 2024, ApJ, 965, L6 [NASA ADS] [CrossRef] [Google Scholar]
- Barbary, K., Boone, K., McCully, C., et al. 2016, https://doi.org/10.5281/zenodo.159035 [Google Scholar]
- Barrows, R. S., Mezcua, M., Comerford, J. M., & Stern, D. 2024, ApJ, 964, 187 [Google Scholar]
- Bertin, E., & Arnouts, S. 1996, A&AS, 117, 393 [NASA ADS] [CrossRef] [EDP Sciences] [Google Scholar]
- Bogdán, Á., Goulding, A. D., Natarajan, P., et al. 2024, Nat. Astron., 8, 126 [Google Scholar]
- Bonaventura, N., Lyu, J., Rieke, G. H., et al. 2024, ArXiv e-prints [arXiv:2401.07863] [Google Scholar]
- Boogaard, L. A., Decarli, R., González-López, J., et al. 2019, ApJ, 882, 140 [NASA ADS] [CrossRef] [Google Scholar]
- Boogaard, L. A., van der Werf, P., Weiss, A., et al. 2020, ApJ, 902, 109 [NASA ADS] [CrossRef] [Google Scholar]
- Boogaard, L. A., Gillman, S., Melinder, J., et al. 2024, ApJ, 969, 27 [NASA ADS] [CrossRef] [Google Scholar]
- Bradley, L., Sipőcz, B., Robitaille, T., et al. 2022, https://doi.org/10.5281/zenodo.6825092 [Google Scholar]
- Brammer, G., & Matharu, J. 2021, https://doi.org/10.5281/zenodo.5012699 [Google Scholar]
- Brammer, G., Strait, V., Matharu, J., & Momcheva, I. 2022, https://doi.org/10.5281/zenodo.6672538 [Google Scholar]
- Burtscher, L., Orban de Xivry, G., Davies, R. I., et al. 2015, A&A, 578, A47 [NASA ADS] [CrossRef] [EDP Sciences] [Google Scholar]
- Cappelluti, N., Li, Y., Ricarte, A., et al. 2017, ApJ, 837, 19 [NASA ADS] [CrossRef] [Google Scholar]
- Cardamone, C. N., Urry, C. M., Damen, M., et al. 2008, ApJ, 680, 130 [Google Scholar]
- Chabrier, G. 2003, PASP, 115, 763 [Google Scholar]
- Chen, C.-T. J., Hickox, R. C., Goulding, A. D., et al. 2017, ApJ, 837, 145 [Google Scholar]
- Comastri, A., Setti, G., Zamorani, G., & Hasinger, G. 1995, A&A, 296, 1 [NASA ADS] [Google Scholar]
- Costantin, L., Gillman, S., Boogaard, L. A., et al. 2025, A&A, 699, A360 [NASA ADS] [CrossRef] [EDP Sciences] [Google Scholar]
- Donley, J. L., Koekemoer, A. M., Brusa, M., et al. 2012, ApJ, 748, 142 [Google Scholar]
- Donley, J. L., Kartaltepe, J., Kocevski, D., et al. 2018, ApJ, 853, 63 [NASA ADS] [CrossRef] [Google Scholar]
- Eisenstein, D. J., Johnson, B. D., Robertson, B., et al. 2023, ArXiv e-prints [arXiv:2310.12340] [Google Scholar]
- Fabian, A. C., & Barcons, X. 1992, ARA&A, 30, 429 [Google Scholar]
- Fruchter, A. S., & Hook, R. N. 2002, PASP, 114, 144 [NASA ADS] [CrossRef] [Google Scholar]
- Gaia Collaboration (Brown, A. G. A., et al.) 2021, A&A, 649, A1 [NASA ADS] [CrossRef] [EDP Sciences] [Google Scholar]
- Gandhi, P., Horst, H., Smette, A., et al. 2009, A&A, 502, 457 [NASA ADS] [CrossRef] [EDP Sciences] [Google Scholar]
- Gao, Y., Wang, Q. D., Appleton, P. N., & Lucas, R. A. 2003, ApJ, 596, L171 [NASA ADS] [CrossRef] [Google Scholar]
- Gillman, S., Gullberg, B., Brammer, G., et al. 2023, A&A, 676, A26 [NASA ADS] [CrossRef] [EDP Sciences] [Google Scholar]
- Gillman, S., Smail, I., Gullberg, B., et al. 2024, A&A, 691, A299 [NASA ADS] [CrossRef] [EDP Sciences] [Google Scholar]
- Häußler, B., Bamford, S. P., Vika, M., et al. 2013, MNRAS, 430, 330 [Google Scholar]
- Hickox, R. C., & Alexander, D. M. 2018, ARA&A, 56, 625 [Google Scholar]
- Hogg, D. W. 1999, ArXiv e-prints [arXiv:astro-ph/9905116] [Google Scholar]
- Hoyos, C., Aragón-Salamanca, A., Gray, M., & Maltby, D. 2011, in Highlights of Spanish Astrophysics VI, eds. M. R. Zapatero Osorio, J. Gorgas, J. Maíz Apellániz, J. R. Pardo, & A. Gil de Paz, 384 [Google Scholar]
- Hoyos, C., Aragón-Salamanca, A., Gray, M. E., et al. 2012, MNRAS, 419, 2703 [NASA ADS] [CrossRef] [Google Scholar]
- Iwasawa, K., Sanders, D. B., Teng, S. H., et al. 2011, A&A, 529, A106 [NASA ADS] [CrossRef] [EDP Sciences] [Google Scholar]
- Ji, Z., Giavalisco, M., Kirkpatrick, A., et al. 2022, ApJ, 925, 74 [NASA ADS] [CrossRef] [Google Scholar]
- Kartaltepe, J. S., Rose, C., Vanderhoof, B. N., et al. 2023, ApJ, 946, L15 [NASA ADS] [CrossRef] [Google Scholar]
- Kirkpatrick, A., Alberts, S., Pope, A., et al. 2017, ApJ, 849, 111 [NASA ADS] [CrossRef] [Google Scholar]
- Kocevski, D. D., Brightman, M., Nandra, K., et al. 2015, ApJ, 814, 104 [Google Scholar]
- Kotilainen, J. K., Ward, M. J., Boisson, C., Depoy, D. L., & Smith, M. G. 1992, MNRAS, 256, 149 [Google Scholar]
- Langeroodi, D., & Hjorth, J. 2023, ApJ, 946, L40 [NASA ADS] [CrossRef] [Google Scholar]
- Lehmer, B. D., Alexander, D. M., Bauer, F. E., et al. 2010, ApJ, 724, 559 [Google Scholar]
- Libralato, M., Argyriou, I., Dicken, D., et al. 2024, PASP, 136, 034502 [Google Scholar]
- Liu, T., Tozzi, P., Wang, J.-X., et al. 2017, ApJS, 232, 8 [NASA ADS] [CrossRef] [Google Scholar]
- Lotz, J. M., Primack, J., & Madau, P. 2004, AJ, 128, 163 [NASA ADS] [CrossRef] [Google Scholar]
- Lotz, J. M., Davis, M., Faber, S. M., et al. 2008, ApJ, 672, 177 [NASA ADS] [CrossRef] [Google Scholar]
- Luo, B., Brandt, W. N., Xue, Y. Q., et al. 2017, ApJS, 228, 2 [Google Scholar]
- Lyu, J., Alberts, S., Rieke, G. H., & Rujopakarn, W. 2022, ApJ, 941, 191 [NASA ADS] [CrossRef] [Google Scholar]
- Lyu, J., Alberts, S., Rieke, G. H., et al. 2024, ApJ, 966, 229 [NASA ADS] [CrossRef] [Google Scholar]
- Martini, P., Regan, M. W., Mulchaey, J. S., & Pogge, R. W. 2003, ApJS, 146, 353 [NASA ADS] [CrossRef] [Google Scholar]
- Mateos, S., Alonso-Herrero, A., Carrera, F. J., et al. 2012, MNRAS, 426, 3271 [Google Scholar]
- Mateos, S., Carrera, F. J., Alonso-Herrero, A., et al. 2015, MNRAS, 449, 1422 [Google Scholar]
- Oesch, P. A., Brammer, G., Naidu, R. P., et al. 2023, MNRAS, 525, 2864 [NASA ADS] [CrossRef] [Google Scholar]
- Östlin, G., Pérez-González, P. G., Melinder, J., et al. 2025, A&A, 696, A57 [NASA ADS] [CrossRef] [EDP Sciences] [Google Scholar]
- Peng, C. Y., Ho, L. C., Impey, C. D., & Rix, H.-W. 2010, AJ, 139, 2097 [Google Scholar]
- Perrin, M. D., Sivaramakrishnan, A., Lajoie, C.-P., et al. 2014, SPIE Conf. Ser., 9143, 91433X [NASA ADS] [Google Scholar]
- Primini, F. A., Houck, J. C., Davis, J. E., et al. 2011, ApJS, 194, 37 [Google Scholar]
- Ranalli, P., Comastri, A., Vignali, C., et al. 2013, A&A, 555, A42 [NASA ADS] [CrossRef] [EDP Sciences] [Google Scholar]
- Risaliti, G., Maiolino, R., & Salvati, M. 1999, ApJ, 522, 157 [Google Scholar]
- Rodriguez-Gomez, V., Snyder, G. F., Lotz, J. M., et al. 2019, MNRAS, 483, 4140 [NASA ADS] [CrossRef] [Google Scholar]
- Scoville, N. Z., Evans, A. S., Thompson, R., et al. 2000, AJ, 119, 991 [NASA ADS] [CrossRef] [Google Scholar]
- Sérsic, J. L. 1963, Boletin de la Asociacion Argentina de Astronomia La Plata Argentina, 6, 41 [Google Scholar]
- Shivaei, I., Alberts, S., Florian, M., et al. 2024, A&A, 690, A89 [NASA ADS] [CrossRef] [EDP Sciences] [Google Scholar]
- Silverman, J. D., Mainieri, V., Ding, X., et al. 2023, ApJ, 951, L41 [NASA ADS] [CrossRef] [Google Scholar]
- Snyder, G. F., Torrey, P., Lotz, J. M., et al. 2015, MNRAS, 454, 1886 [NASA ADS] [CrossRef] [Google Scholar]
- Stern, D. 2015, ApJ, 807, 129 [Google Scholar]
- Tanaka, T. S., Silverman, J. D., Ding, X., et al. 2024, ArXiv e-prints [arXiv:2401.13742] [Google Scholar]
- Taylor, M. B. 2005, ASP Conf. Ser., 347, 29 [Google Scholar]
- Taylor, M. B. 2006, ASP Conf. Ser., 351, 666 [Google Scholar]
- Ueda, Y., Akiyama, M., Ohta, K., & Miyaji, T. 2003, ApJ, 598, 886 [NASA ADS] [CrossRef] [Google Scholar]
- Walter, F., Decarli, R., Aravena, M., et al. 2016, ApJ, 833, 67 [Google Scholar]
- Weaver, J., Zalesky, L., Allen, N., & Taamoli, S. 2023, Astrophysics Source Code Library [record ascl:2312.016] [Google Scholar]
- Whitaker, K. E., Ashas, M., Illingworth, G., et al. 2019, ApJS, 244, 16 [CrossRef] [Google Scholar]
- Wright, G. S., Rieke, G. H., Glasse, A., et al. 2023, PASP, 135, 048003 [NASA ADS] [CrossRef] [Google Scholar]
Appendix A: X-ray Sources in MIDIS
Properties of the 31 X-ray sources in the MIDIS MIRI field of view.
Appendix B: Rest-frame 2 μm morphology
Rest-Frame 2 μm GALFIT and STATMORPH outputs, ordered by X-ray ID from Luo et al. (2017).
Appendix C: Visual classification: details
Visual classification for each object in our sample, ordered by X-ray ID from Luo et al. (2017).
Appendix D: Colour maps
A full version of Appendix C is available in electronic format on the Zenodo platform15. Multi-wavelength imaging and colour maps for all 31 X-ray sources in our sample. For each galaxy, we show, and contour, a 3-arcsecond cutout in the NIRCam F210M band (a), NIRCam F480M band (b) and the MIRI F560W band (c). For each cutout, we label the galaxy’s ID as given by Luo et al. (2017), measured flux in each band and spectroscopic redshift. We also indicate the FWHM of the PSF in each band by the white circle in the lower right corner. The F210M/F560W (d) and F480M/F560W (e) colour maps are shown for each source, highlighting the presence of any AGN (point source) component at longer (NIR) wavelengths.
Appendix E: Parametric modelling
A full version of Appendix D is available in electronic format on the Zenodo platform15. The rest-frame 2 μm morphological analysis for the 31 X-ray sources. For each source, we show a 10-arcsecond cutout, best-fit Sérsic plus PSF parametric model and normalised residuals (residual/σ). We label the source ID, MIRI filter, non-parametric (Gini, M20, C, A, S) and parametric (nSérsic, Re) morphological parameters, as well as goodness of fit parameters (χred.2, RFF). For each parametric model we also annotate the Sérsic and PSF derived magnitude.
Appendix F: Morphology statistics
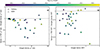 |
Fig. F.1. The GALFIT modelling statistics for the 31 X-ray sources at rest-frame 2 μm. We compare the single Sérsic fit to a Sérsic plus PSF model, analysing the difference in reduced chi-squared (a), and RFF (b). For the majority of sources, we identify improved reduced chi-squared and RFF values between the two models. |
All Tables
Visual classification statistics of the 31 X-ray emitting galaxies detected in the MIDIS survey.
Rest-Frame 2 μm GALFIT and STATMORPH outputs, ordered by X-ray ID from Luo et al. (2017).
Visual classification for each object in our sample, ordered by X-ray ID from Luo et al. (2017).
All Figures
|
Fig. 1. MIDIS MIRI 5.6 μm image in the HUDF (centre) with |
| In the text | |
|
Fig. 2. Absorption corrected X-ray (0.5−7 keV) luminosity as a function of redshift for the 31 X-ray sources in the MIDIS survey coloured by column density (NH). Where appropriate the X-ray luminosity has been updated to reflect the spectroscopic redshift, see Section 4.2. In the background we show the X-ray emitting sources identified by Luo et al. (2017) in the 7 Ms survey. We show the distribution for the MIDIS sources (black histogram) and 7 Ms sources (grey histogram, scaled down by a factor 10) on each axis. A clear trend of increasing X-ray luminosity with redshift is apparent, as is expected for a flux-limited sample. |
| In the text | |
|
Fig. 3. JWST multi-wavelength imaging and colour maps for two examples of the X-ray sources in our sample. The full sample is shown in Appendix D. For each galaxy, we show, and contour, a 3-arcsec cutout in the NIRCam F210M band (a), the NIRCam F480M band (b) and the MIRI F560W band (c). We label the galaxy’s ID given by Luo et al. (2017), measured flux in each band, and spectroscopic redshift. We also indicate the FWHM of the PSF in each band by the white circle in the lower right corner. The F210M/F560W (d) and F480M/F560W (e) colour maps are shown for each source, highlighting the presence of any AGN (point source) component at longer (NIR) wavelengths. |
| In the text | |
|
Fig. 4. Examples of the rest-frame 2 μm morphological analysis for six X-ray sources in our sample, highlighting the diverse range of morphology in the sample. For each source, we show a 10-arcsecond cutout, best-fit Sérsic plus PSF parametric model and normalised residuals (residual/σ). We label the source ID, MIRI filter, non-parametric (Gini, M20, C, A, S) and parametric ( |
| In the text | |
|
Fig. 5. Near-IR colour properties of the 31 X-ray sources coloured by X-ray luminosity. Grey points are star-forming galaxies in the MIDIS field of view above z > 0.5. We show the F444W − F770W colour versus F356W − F560W colour (a), highlighting the NIR colour selected AGN region proposed by Kirkpatrick et al. (2017) (dashed red line) and Donley et al. (2012) (dashed orange line). In panel b we plot the MIRI colours, F560W − F770W versus F770W − F1000W. The three X-ray emitting galaxies with F770W − F1000W > 1.5 have a colour likely driven by the presence of the 6.2 μm PAH feature in the F1000W filter with redshifts between z = 0.46−0.67 as has been demonstrated by Langeroodi & Hjorth (2023). |
| In the text | |
|
Fig. 6. Example comparison of the three morphological analysis methods, for the MIRI/F560W waveband, for each source: Gini (STATMORPH) vs fractional point-source flux density, ffPSF (GALFITM), with the visual classifications of point-source presence indicated by colour-coding of each symbol (purple – no point-source identified; blue – likely; green – yes; yellow – yes, with a visible PSF characteristic diffraction pattern). The source classification, ‘AGN’ or ‘galaxy’, is indicated by the symbol shape: a triangle and a star, respectively. The numbers by each symbol give the X-ray source reference (XID, Luo et al. 2017). |
| In the text | |
|
Fig. 7. Relation between the ratio of rest-frame 2 μm point source (PS) luminosity to total (PSF + Sérsic) 2 μm luminosity (a) and PS luminosity (b) as a function of the 0.5−7.0 keV X-ray luminosity. In each panel we show the Spearman rank correlation coefficient (rs) for the relations, a running median (grey squares) in bins of 1 dex in X-ray luminosity. We exclude sources in panel b with a PS to total luminosity ratio of less than 20%. We further show the one-to-one relation (dashed black line) and overlay nearby (z ∼ 0.01) AGNs from Burtscher et al. (2015), as well as the 6 μm – X-ray luminosity relations from Mateos et al. (2015) for z ≃ 0.2−2.8 AGN and higher-redshift quasars from Chen et al. (2017), as well as the MIRI-SMILES X-ray sources from Lyu et al. (2024). Whilst we identify a strong (r = 0.73) correlation between NIR point-source luminosity and X-ray luminosity in our samples, at log10(LXc) ≤ 43 erg s−1, we identify higher 2 μm PS luminosities than other studies, with no strong correlation with column density (NH). |
| In the text | |
|
Fig. F.1. The GALFIT modelling statistics for the 31 X-ray sources at rest-frame 2 μm. We compare the single Sérsic fit to a Sérsic plus PSF model, analysing the difference in reduced chi-squared (a), and RFF (b). For the majority of sources, we identify improved reduced chi-squared and RFF values between the two models. |
| In the text | |
Current usage metrics show cumulative count of Article Views (full-text article views including HTML views, PDF and ePub downloads, according to the available data) and Abstracts Views on Vision4Press platform.
Data correspond to usage on the plateform after 2015. The current usage metrics is available 48-96 hours after online publication and is updated daily on week days.
Initial download of the metrics may take a while.