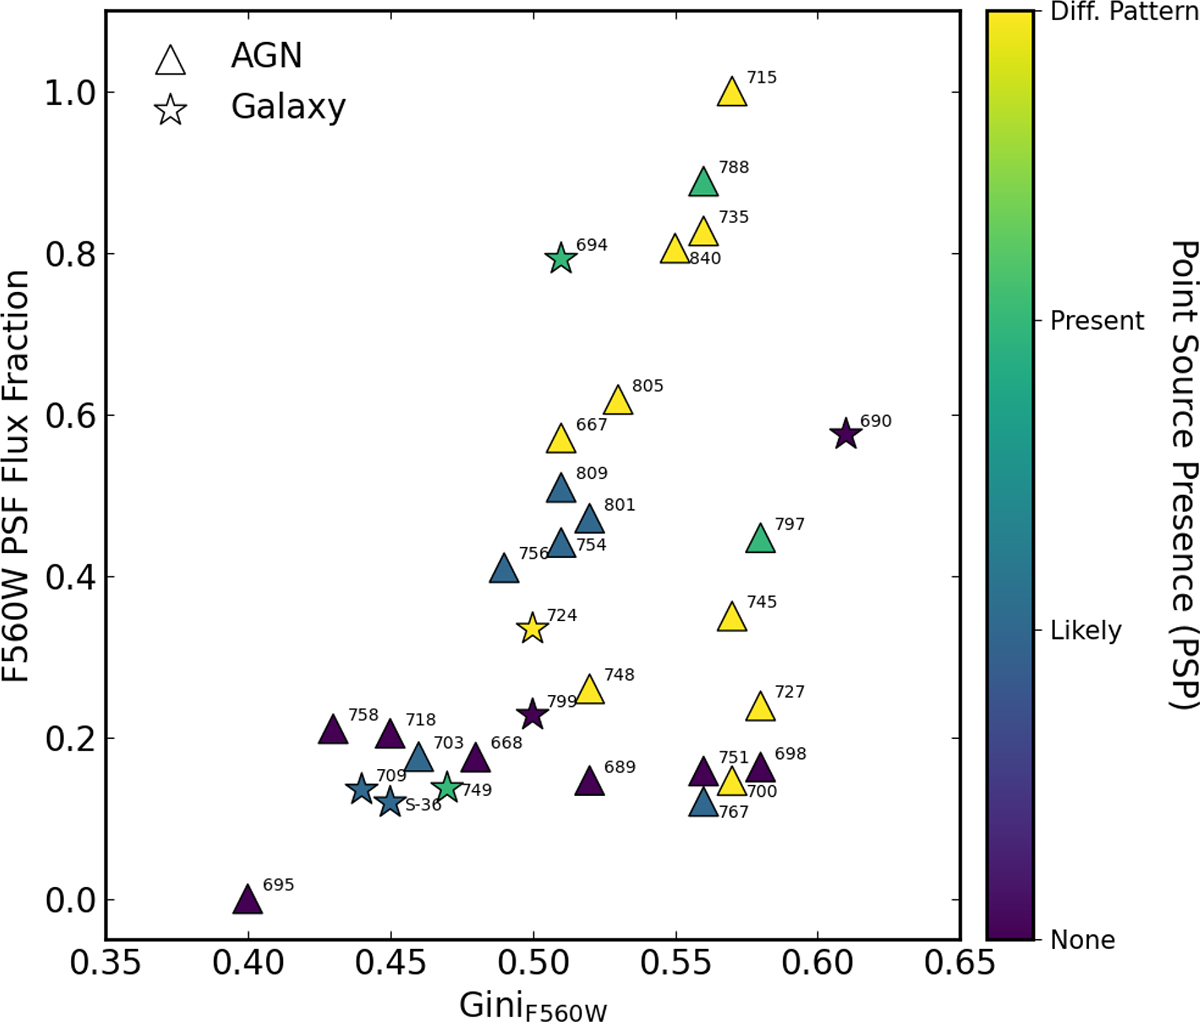
Fig. 6.
Download original image
Example comparison of the three morphological analysis methods, for the MIRI/F560W waveband, for each source: Gini (STATMORPH) vs fractional point-source flux density, ffPSF (GALFITM), with the visual classifications of point-source presence indicated by colour-coding of each symbol (purple – no point-source identified; blue – likely; green – yes; yellow – yes, with a visible PSF characteristic diffraction pattern). The source classification, ‘AGN’ or ‘galaxy’, is indicated by the symbol shape: a triangle and a star, respectively. The numbers by each symbol give the X-ray source reference (XID, Luo et al. 2017).
Current usage metrics show cumulative count of Article Views (full-text article views including HTML views, PDF and ePub downloads, according to the available data) and Abstracts Views on Vision4Press platform.
Data correspond to usage on the plateform after 2015. The current usage metrics is available 48-96 hours after online publication and is updated daily on week days.
Initial download of the metrics may take a while.