Fig. 11.
Download original image
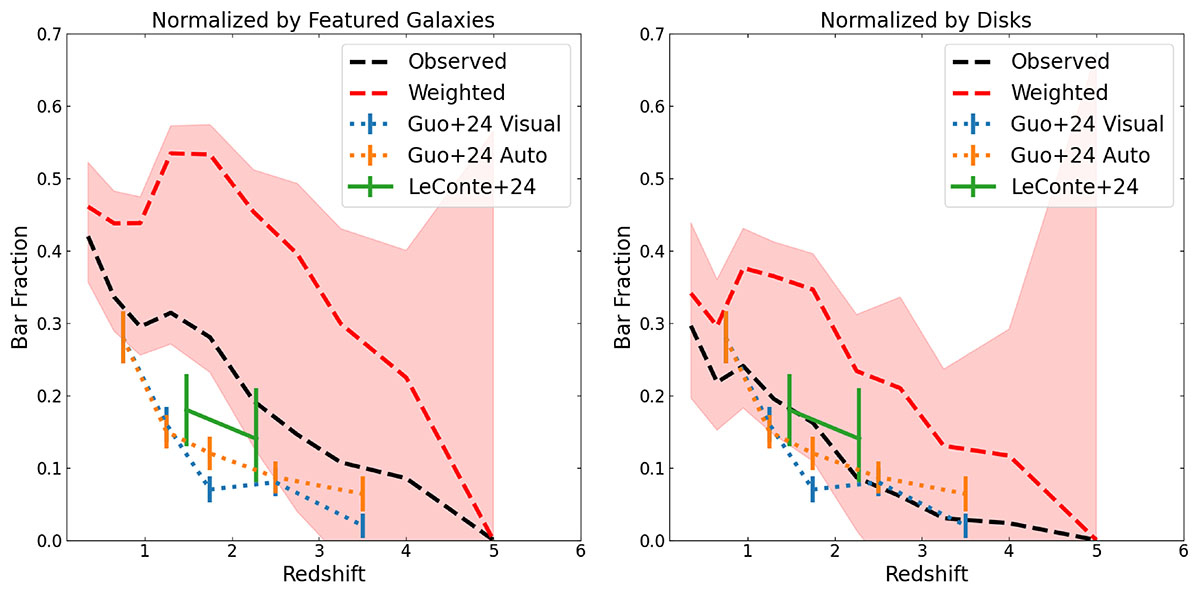
Bar fraction for massive galaxies as a function of redshift. The black dashed line shows the raw observed fraction, while the red dashed line shows the fraction corrected from observational bias (see text for details). The orange and blue dotted lines indicate the published results in CEERS (Guo et al. 2025). The green solid line shows the results by Le Conte et al. (2024).
Current usage metrics show cumulative count of Article Views (full-text article views including HTML views, PDF and ePub downloads, according to the available data) and Abstracts Views on Vision4Press platform.
Data correspond to usage on the plateform after 2015. The current usage metrics is available 48-96 hours after online publication and is updated daily on week days.
Initial download of the metrics may take a while.