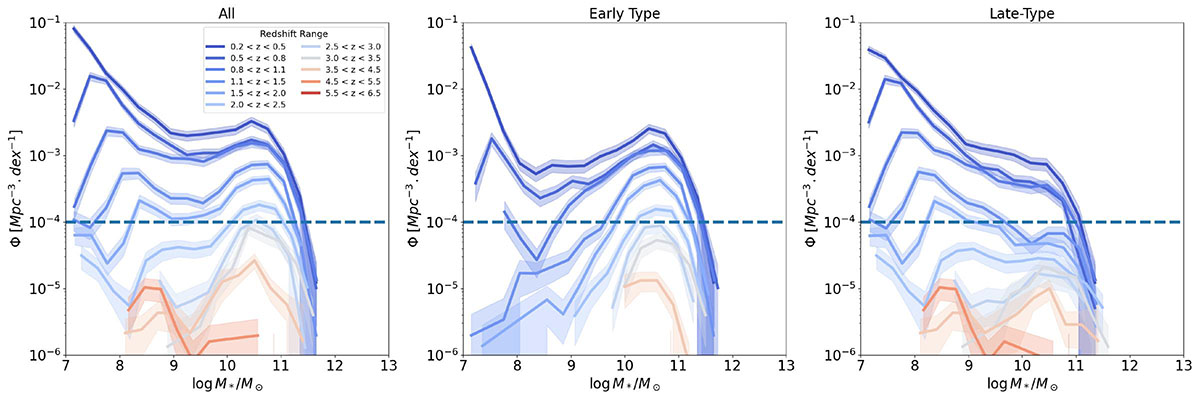
Fig. 9.
Download original image
Stellar mass function of quenched galaxies. The left panel shows all quenched galaxies, the middle panel quenched galaxies with an early-type morphology, and the right panel quenched galaxies with a late-type morphology. The different colors indicate different redshift bins as labeled. The vertical red filled region indicates the stellar mass range impacted by incompleteness.
Current usage metrics show cumulative count of Article Views (full-text article views including HTML views, PDF and ePub downloads, according to the available data) and Abstracts Views on Vision4Press platform.
Data correspond to usage on the plateform after 2015. The current usage metrics is available 48-96 hours after online publication and is updated daily on week days.
Initial download of the metrics may take a while.