Fig. A.3
Download original image
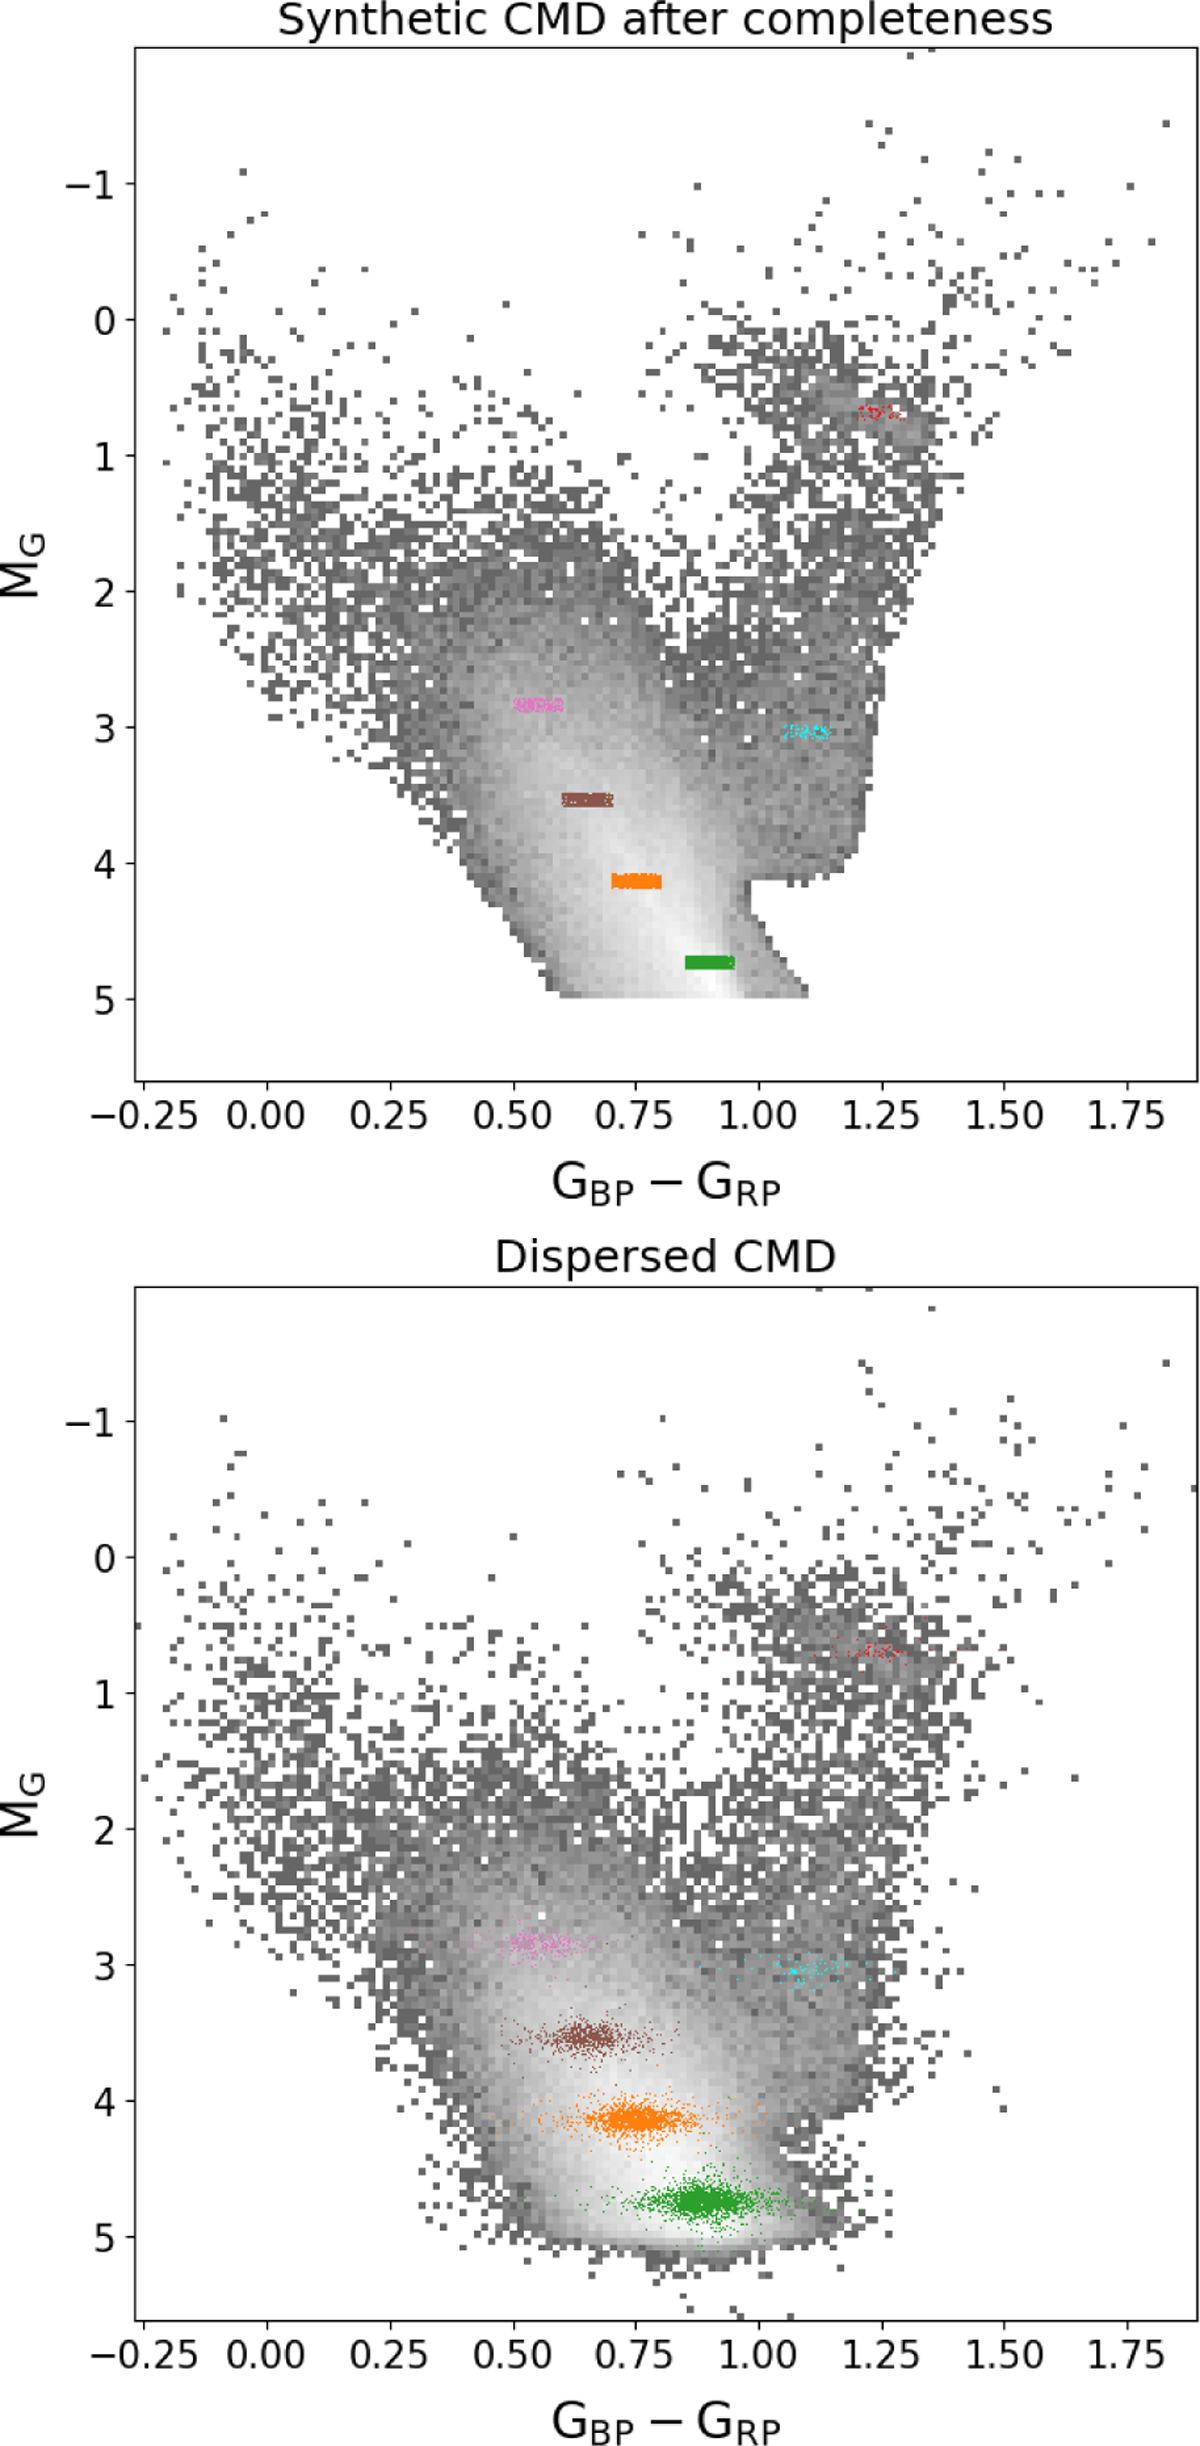
Error simulation using DisPar-Gaia. Top panel: Synthetic CMD before error simulation. To illustrate observational uncertainties some particular regions are highlighted in different colours. Bottom panel: Same synthetic CMD after simulating photometric errors using GAIA-DisPar. The coloured points represent the position of the synthetic stars highlighted in the top panel after the error simulation. As expected, fainter stars are more affected by observational uncertainties than brighter stars.
Current usage metrics show cumulative count of Article Views (full-text article views including HTML views, PDF and ePub downloads, according to the available data) and Abstracts Views on Vision4Press platform.
Data correspond to usage on the plateform after 2015. The current usage metrics is available 48-96 hours after online publication and is updated daily on week days.
Initial download of the metrics may take a while.