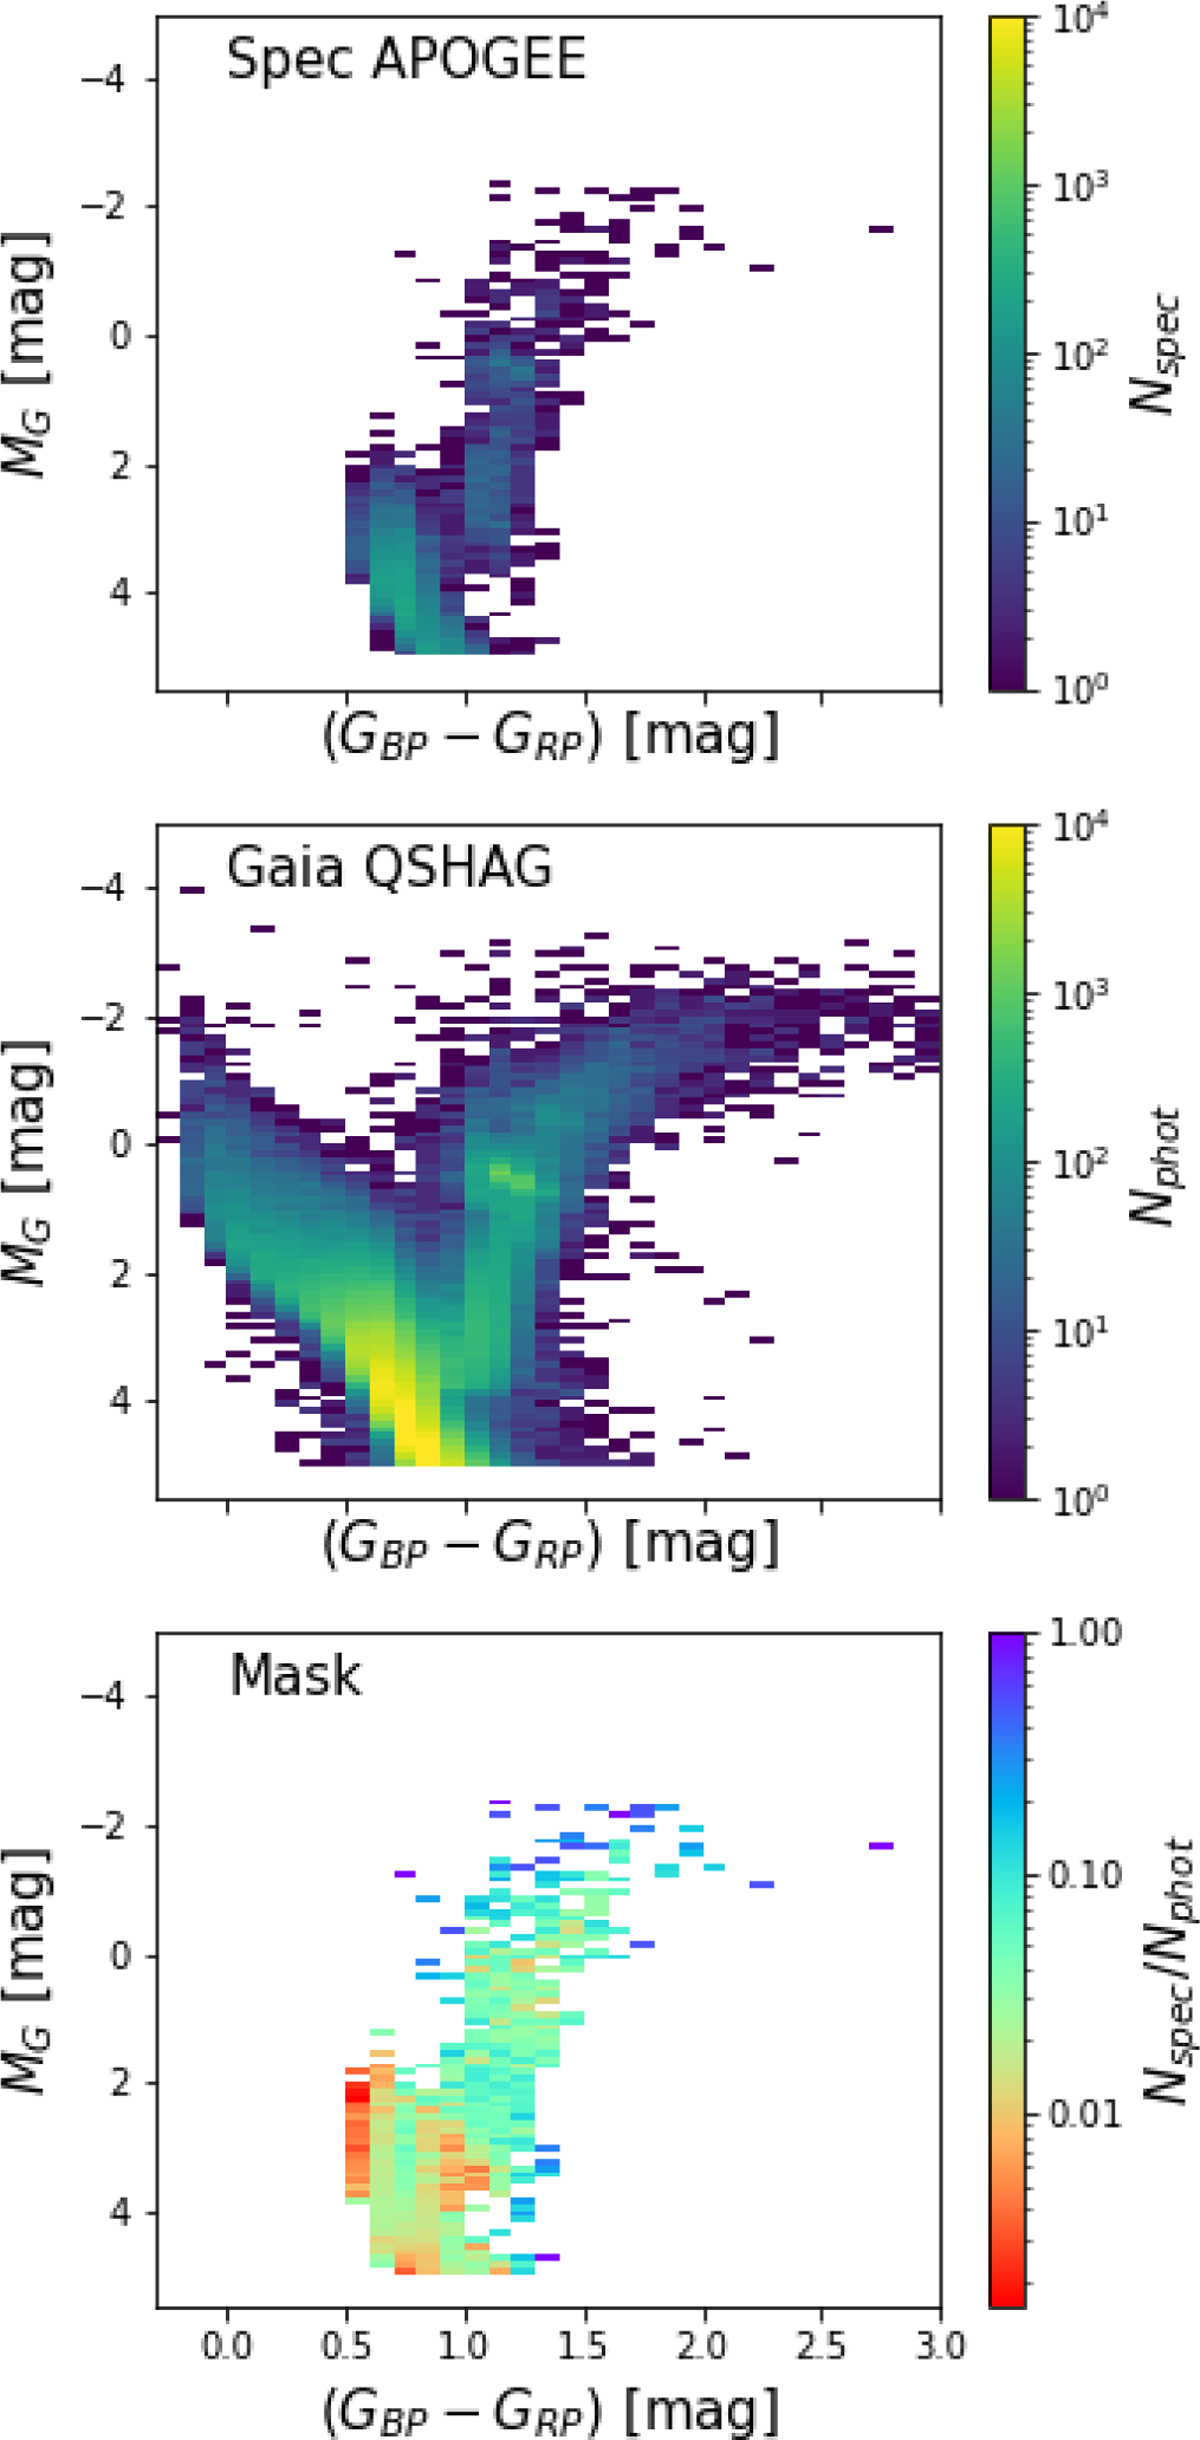
Fig. B.1
Download original image
Top panel: Density map in the colour-magnitude diagram, in bins of 0.1 mag in MG and GBP-GRP of APOGEE spectroscopic observations within the volume analysed. Middle panel: Same as top panel by for Gaia photometric observations in the volume analysed. Bottom panel: Mask, that is the fraction of spectroscopic measurements with respect to the photometric observations in the same bins as top and middle panels.
Current usage metrics show cumulative count of Article Views (full-text article views including HTML views, PDF and ePub downloads, according to the available data) and Abstracts Views on Vision4Press platform.
Data correspond to usage on the plateform after 2015. The current usage metrics is available 48-96 hours after online publication and is updated daily on week days.
Initial download of the metrics may take a while.