Fig. C.4
Download original image
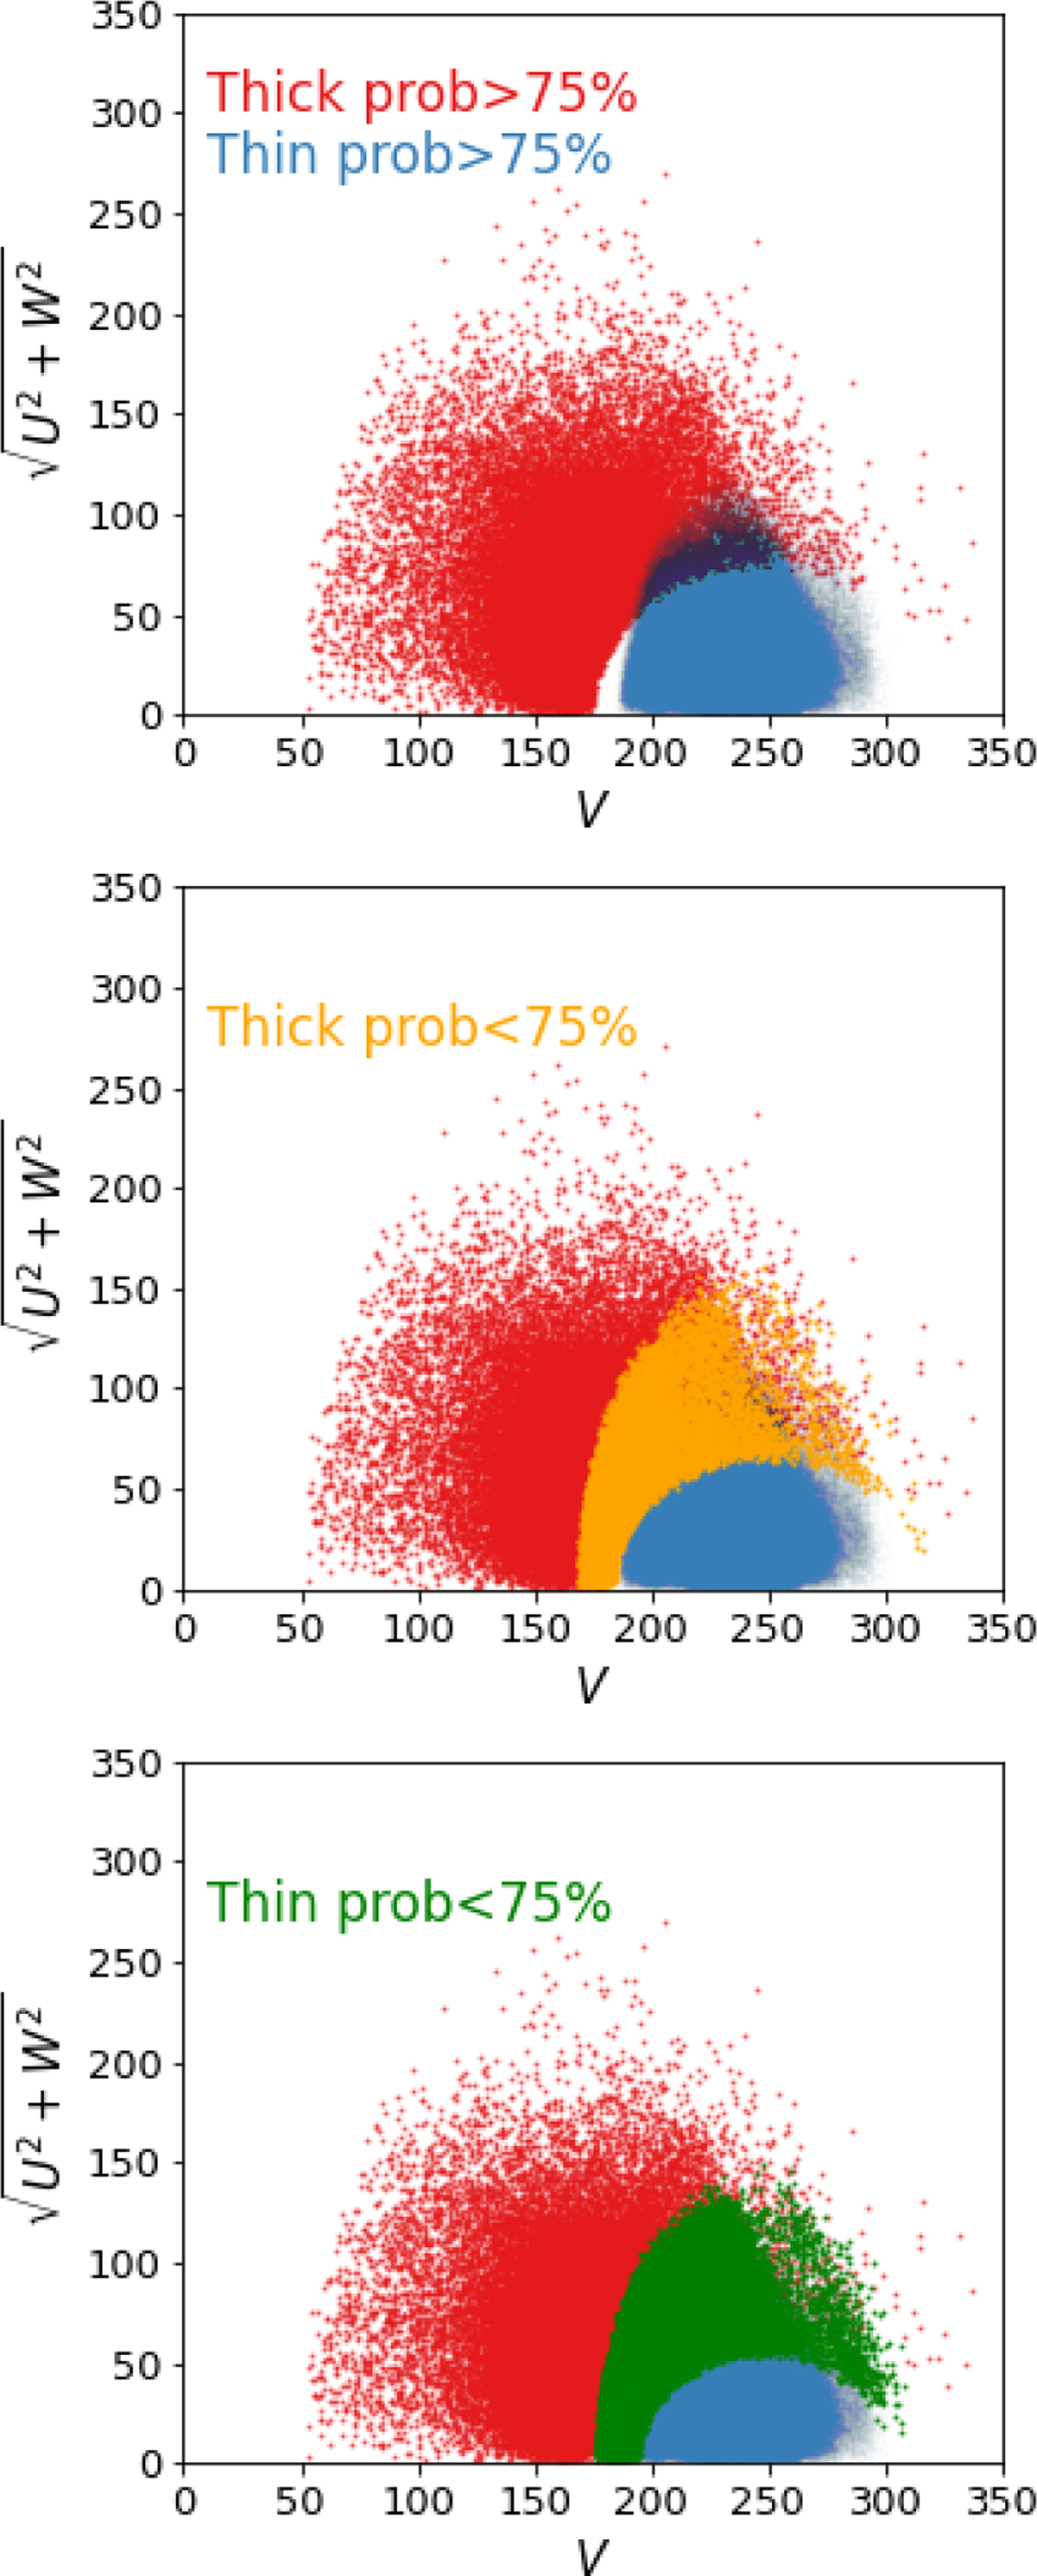
Top panel: Toomre diagram of the selected ks_thin disc (blue) and ks_thick disc (red) stellar samples, considering quality selection criteria, as in Figure 2. Middle panel: Same as the top panel but with stars with probabilities between 50% and 75% of belonging to the kinematic thick disc over plotted in orange. Bottom panel: Same as top panel but with stars with probabilities between 50% and 75% of belonging to the kinematic thin disc overplotted in green.
Current usage metrics show cumulative count of Article Views (full-text article views including HTML views, PDF and ePub downloads, according to the available data) and Abstracts Views on Vision4Press platform.
Data correspond to usage on the plateform after 2015. The current usage metrics is available 48-96 hours after online publication and is updated daily on week days.
Initial download of the metrics may take a while.