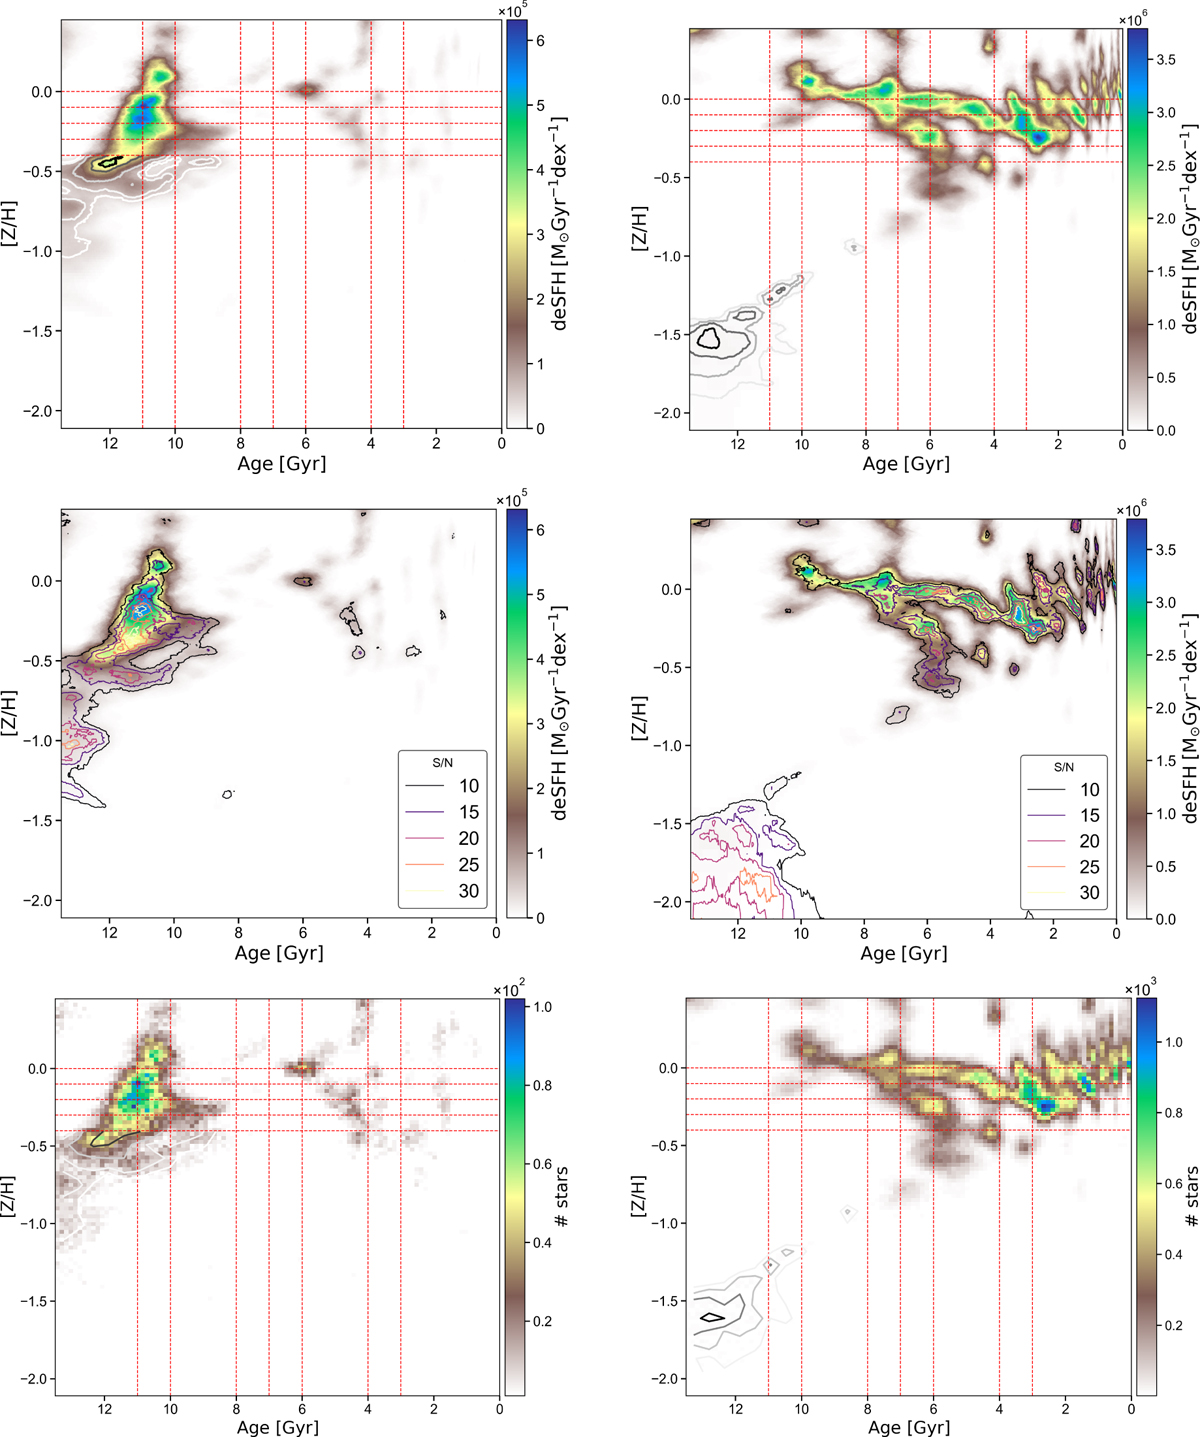
Fig. 4
Download original image
Top panels: dynamically evolved star formation histories, i.e., the stellar mass formed as a function of age and total metallicity ([Z/H]), for the ks_thick (left) and ks_thin (right) discs. Middle panels: same as top panels but including contour lines indicating the signal-to-noise ratio (S/N) of the resulting deSFH. Bottom panels: age and metallicity distribution of living stars in the volume analysed. The colour code indicates now the number of stars per bin in a 100 × 100 grid. In top and bottom panels: red dotted lines mark key age and metallicity values (11, 10, 8, 7, 6, 4 and 3 Gyr) and metallicity values (from 0 to −0.4 in steps of 0.1 dex). The contour lines enclose the 10%, 25%, 50%, 75%, and 95% of M⊙ Gyr−1 dex−1 (top) and the number of stars (bottom) within the age range of 13.5 to 8 Gyr and metallicity range of [Z/H] between −2 and −0.4, highlighting the structure within this region of parameter space.
Current usage metrics show cumulative count of Article Views (full-text article views including HTML views, PDF and ePub downloads, according to the available data) and Abstracts Views on Vision4Press platform.
Data correspond to usage on the plateform after 2015. The current usage metrics is available 48-96 hours after online publication and is updated daily on week days.
Initial download of the metrics may take a while.