Fig. 6
Download original image
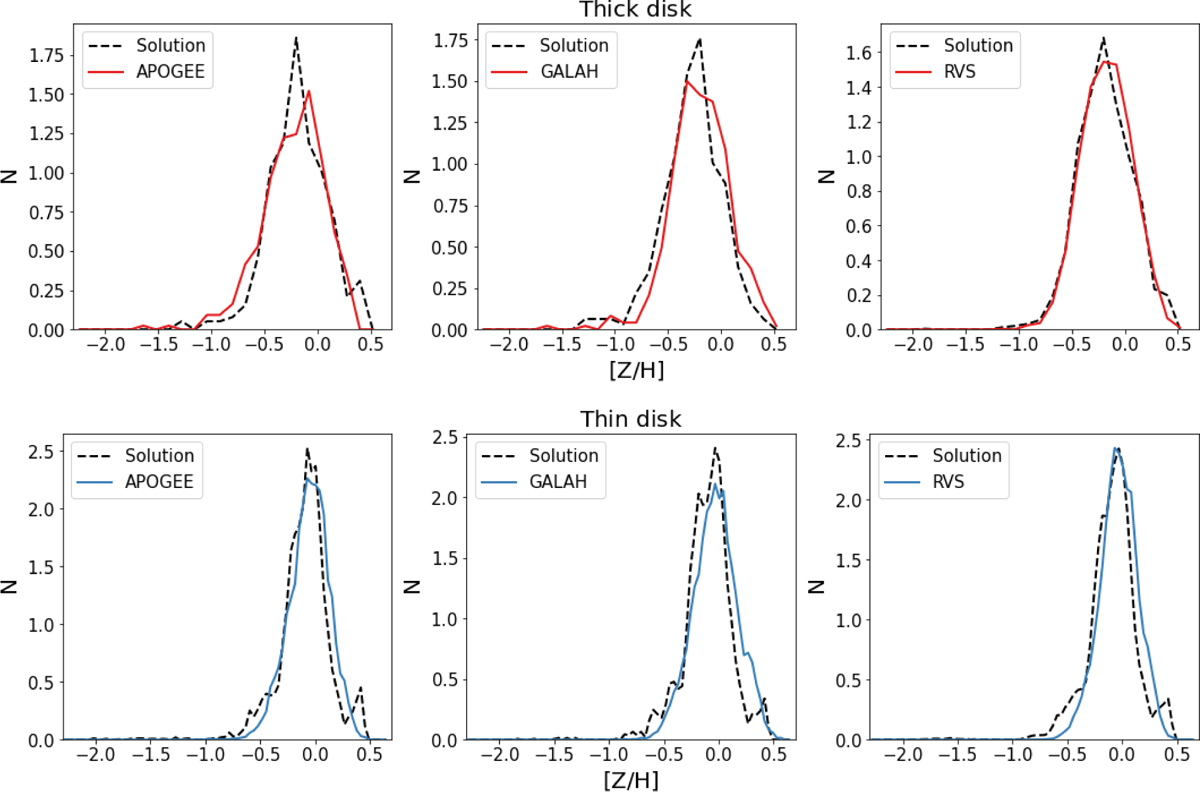
Metallicity distribution functions for the ks_thick disc (top panels) and the ks_thin disc (bottom panels) derived from our solution CMDs compared with those obtained from the spectroscopic surveys APOGEE (left), GALAH (middle), and the Golden Sample of Gaia-RVS (right). The red or blue curves correspond to the spectroscopic MDFs, and the black lines display the MDF distribution from each corresponding masked solution CMD (see text for details).
Current usage metrics show cumulative count of Article Views (full-text article views including HTML views, PDF and ePub downloads, according to the available data) and Abstracts Views on Vision4Press platform.
Data correspond to usage on the plateform after 2015. The current usage metrics is available 48-96 hours after online publication and is updated daily on week days.
Initial download of the metrics may take a while.