Fig. 7
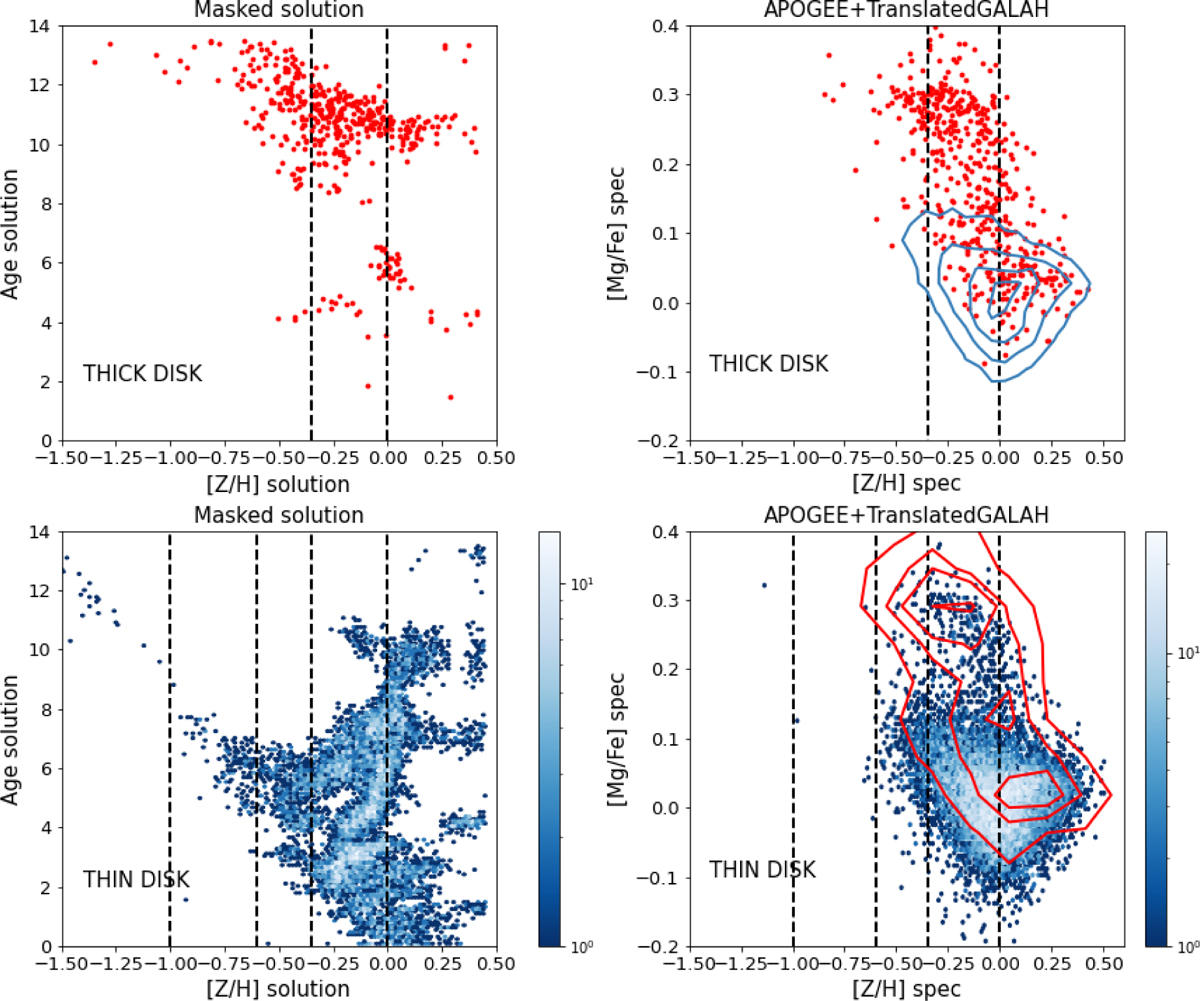
Download original image
Left panels: age-metallicity distribution of the masked solutions for ks_thick disc stars (top, represented by individual red points) and ks_thin disc stars (bottom, shown as a blue-scale hexbin density diagram). This is the same solution as Figure 4 bottom panels, i.e., the distribution of synthetic stars from the best fit which corresponds to the age-metallicity distributions of the living stars in the volume analysed. Right panels: [Mg/Fe] versus [Z/H] (global metallicity; see Section 3.2 in the main text) based on spectroscopic measurements from APOGEE DR17 and GALAH DR3, homogenised using the SpectroTranslator. The ks_thick disc stars are displayed at the top (with individual red points), while ks_thin disc stars appear at the bottom (as a blue-scale hexbin density diagram). The isocontours in red (blue) display the 30%, 60%, and 90% percent of the stellar distribution in the chemical space corresponding to the ks_thin disc(ks_thick disc) in addition to the ks_thick disc(ks_thin disc) stars. The vertical black dashed lines indicate the metallicity ranges of interest discussed in the main text.
Current usage metrics show cumulative count of Article Views (full-text article views including HTML views, PDF and ePub downloads, according to the available data) and Abstracts Views on Vision4Press platform.
Data correspond to usage on the plateform after 2015. The current usage metrics is available 48-96 hours after online publication and is updated daily on week days.
Initial download of the metrics may take a while.