Fig. 2
Download original image
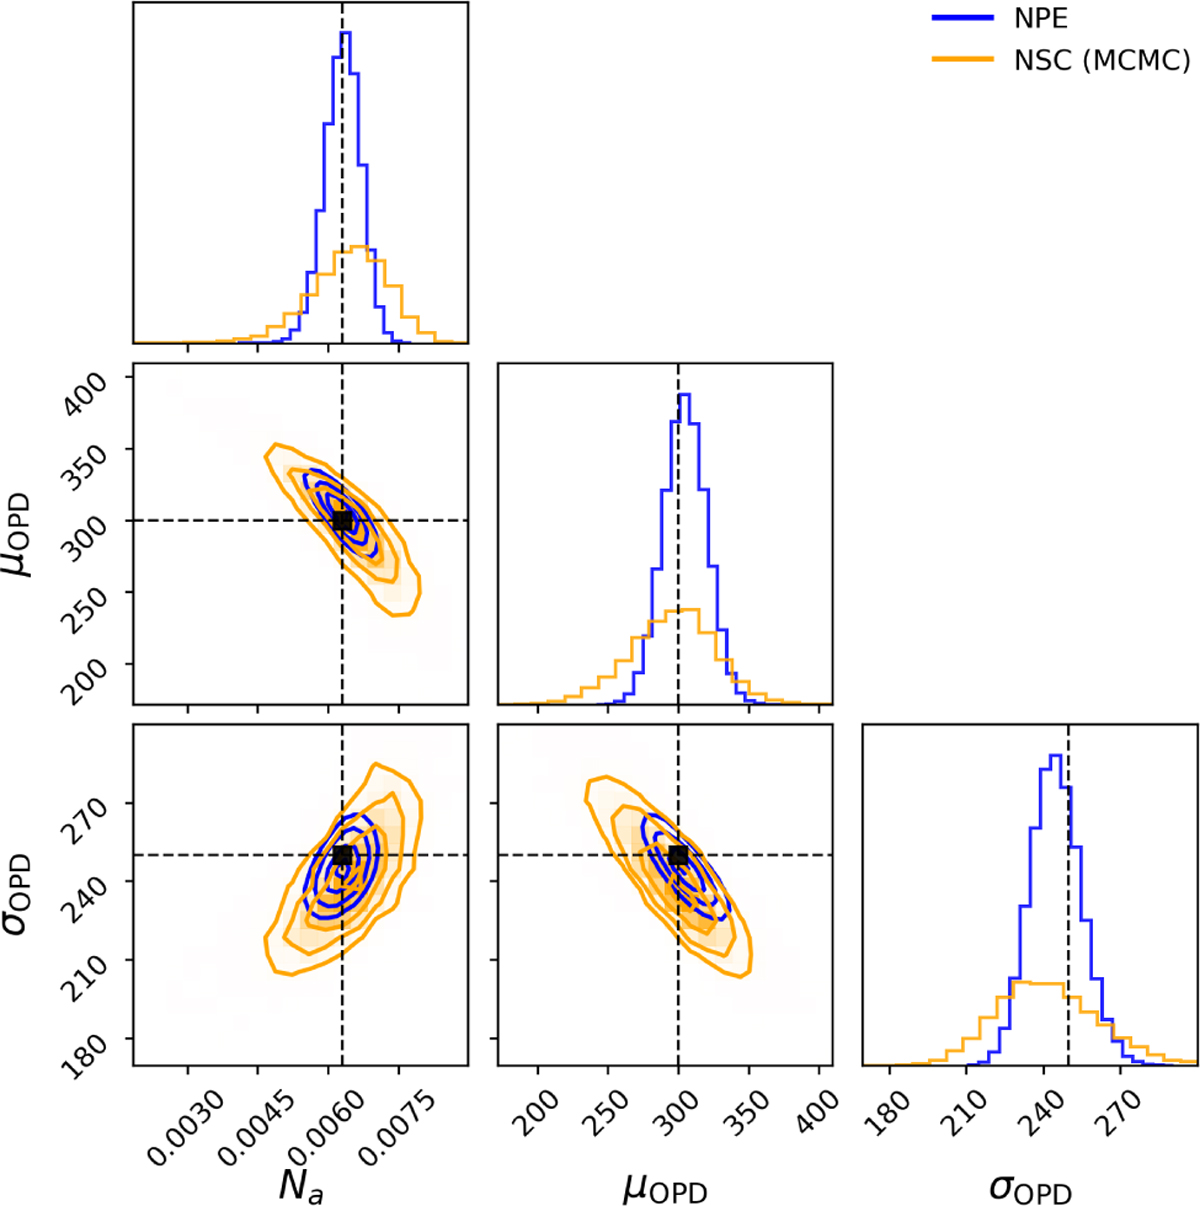
Comparison of the posterior distributions obtained with the NPE (blue) and NSC (orange) methods on the same synthetic dataset. The retrieved parameters are Na, μOPD, and σOPD. The histograms along the diagonal show the marginalized distributions of each parameter, while the off-diagonal plots display the joint distributions between pairs of parameters. The black dashed crosses mark the ground truth values.
Current usage metrics show cumulative count of Article Views (full-text article views including HTML views, PDF and ePub downloads, according to the available data) and Abstracts Views on Vision4Press platform.
Data correspond to usage on the plateform after 2015. The current usage metrics is available 48-96 hours after online publication and is updated daily on week days.
Initial download of the metrics may take a while.