Fig. 5
Download original image
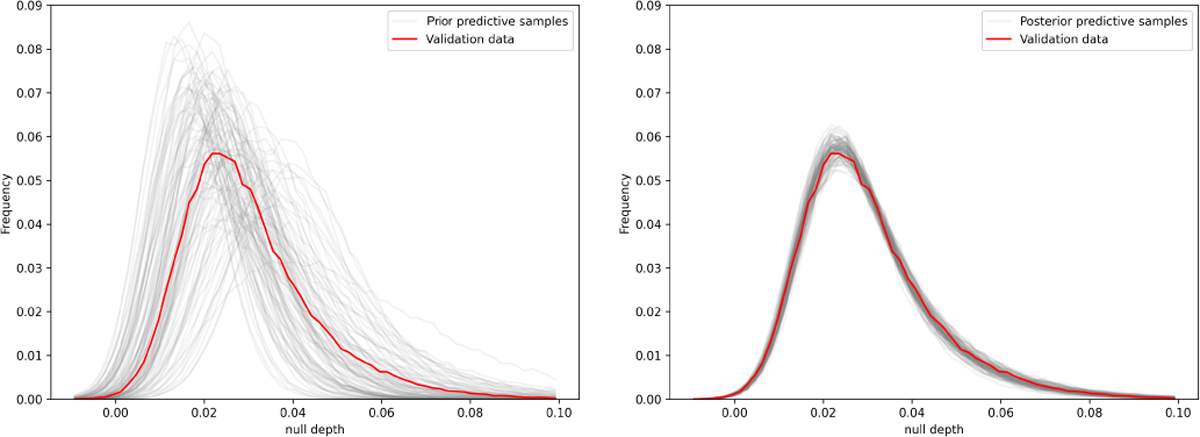
Prior (left) and posterior (right) predictive check for the NPE model. Left: the grey semi-transparent lines represent data generated from the prior predictive distribution, indicating the range of data the model might encounter during training. The red solid line represents the validation data to be inferred by the model, specifically for the measured null. Right: the grey semi-transparent lines represent the posterior predictive samples for each model. The red solid line represents the validation data during the inference.
Current usage metrics show cumulative count of Article Views (full-text article views including HTML views, PDF and ePub downloads, according to the available data) and Abstracts Views on Vision4Press platform.
Data correspond to usage on the plateform after 2015. The current usage metrics is available 48-96 hours after online publication and is updated daily on week days.
Initial download of the metrics may take a while.