Fig. 6
Download original image
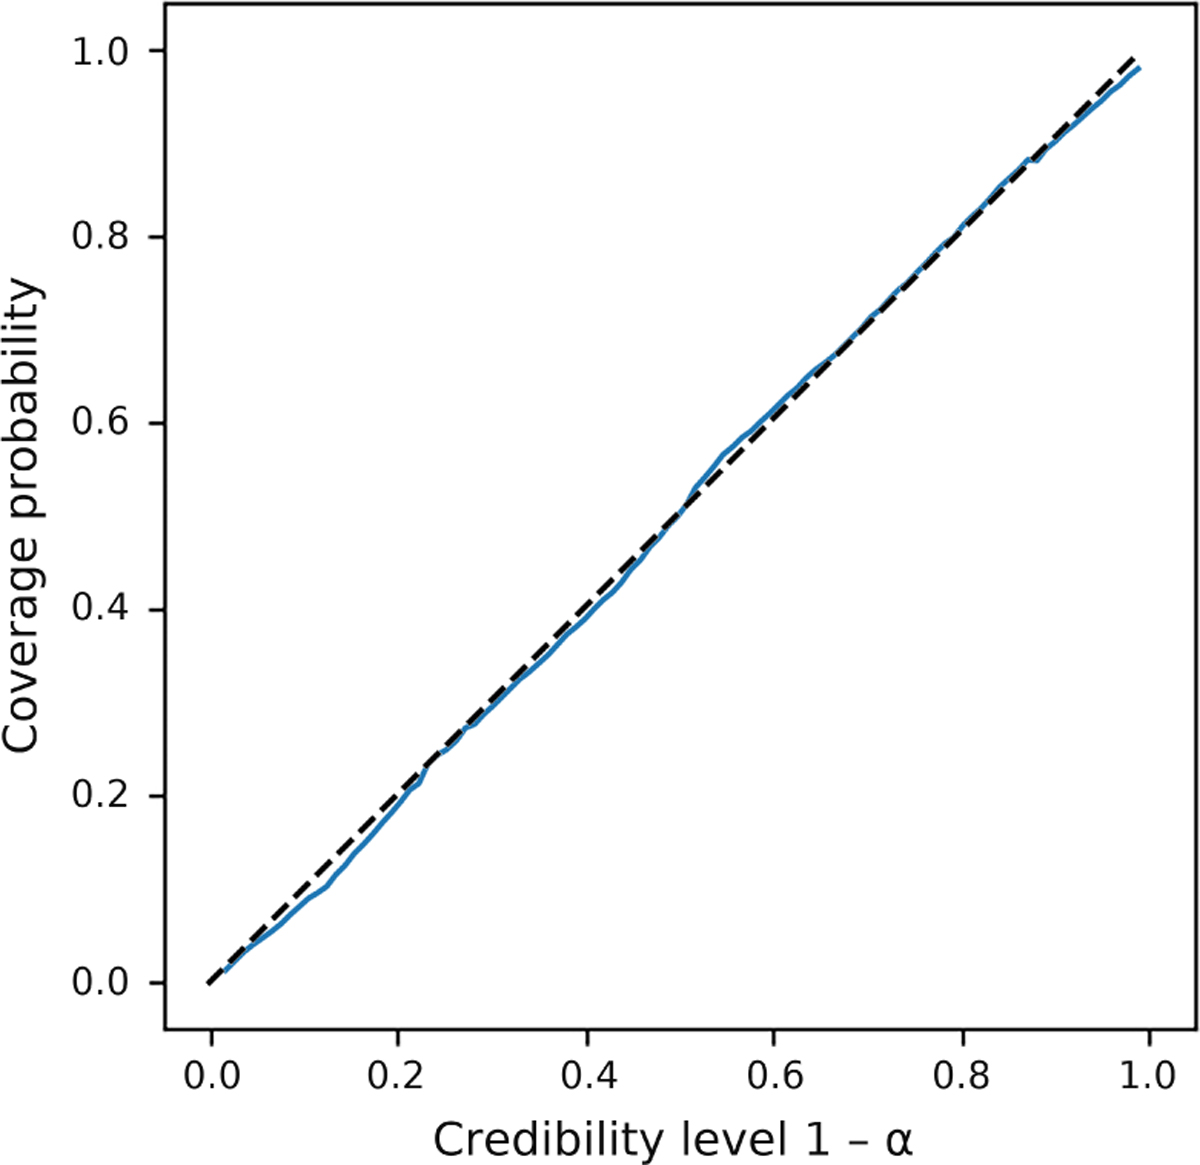
Coverage probability of the NPE model. The plot depicts the coverage probability as a function of the credibility level 1 - α. The solid blue lines represent the model’s coverage probabilities, while the dashed line indicates the ideal scenario in which the coverage probability exactly matches the credibility level. In this ideal case, the parameter values θ used to generate the data x are contained in the 1 - α highest posterior density regions of the approximate posteriors pφ (θ|x) exactly 1 - α% of the time.
Current usage metrics show cumulative count of Article Views (full-text article views including HTML views, PDF and ePub downloads, according to the available data) and Abstracts Views on Vision4Press platform.
Data correspond to usage on the plateform after 2015. The current usage metrics is available 48-96 hours after online publication and is updated daily on week days.
Initial download of the metrics may take a while.