Open Access
Fig. 7
Download original image
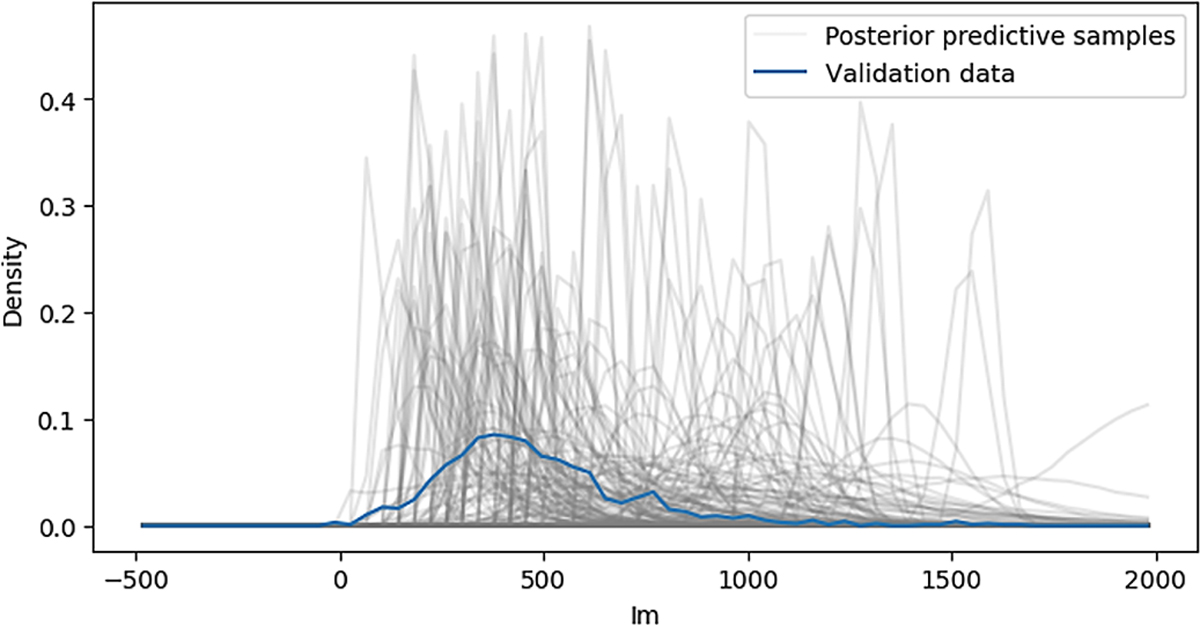
Posterior predictive check for the universal model. The grey semi-transparent lines represent the posterior predictive samples, while the solid blue line indicates the validation data.
Current usage metrics show cumulative count of Article Views (full-text article views including HTML views, PDF and ePub downloads, according to the available data) and Abstracts Views on Vision4Press platform.
Data correspond to usage on the plateform after 2015. The current usage metrics is available 48-96 hours after online publication and is updated daily on week days.
Initial download of the metrics may take a while.