Fig. 1
Download original image
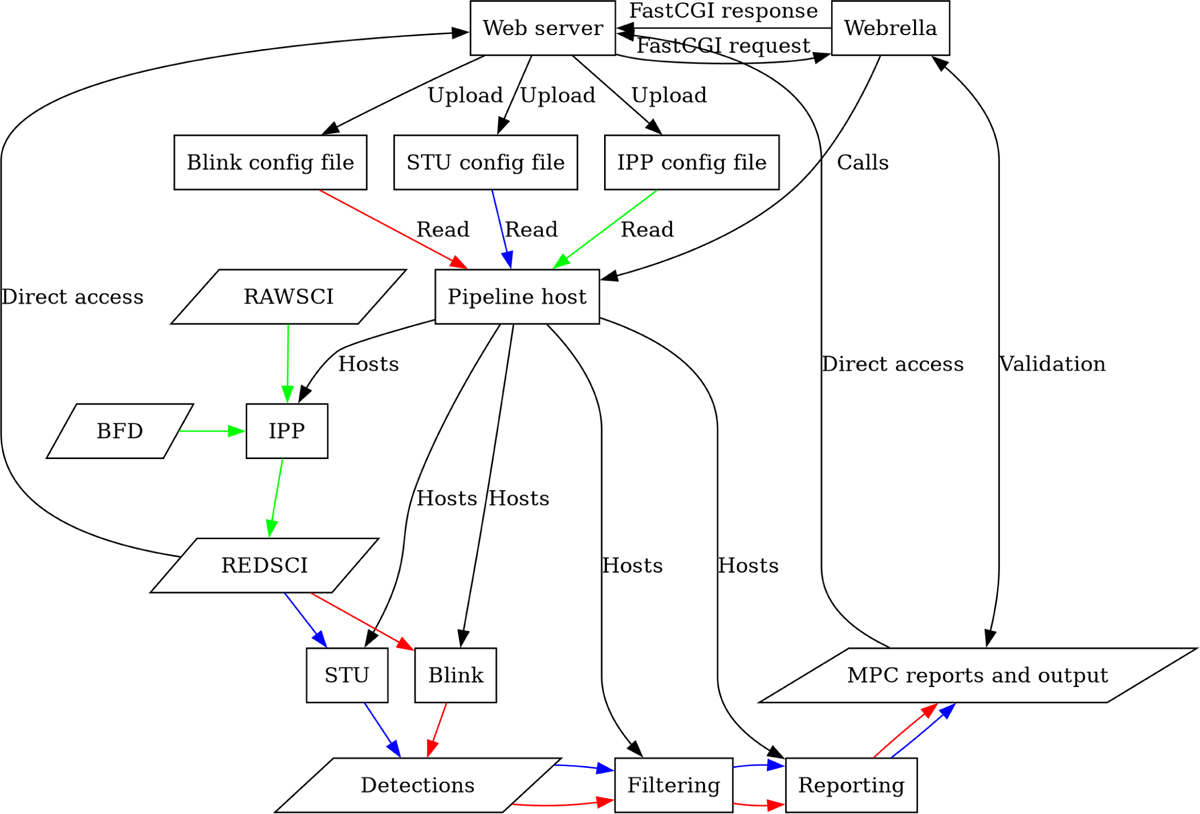
Full system architecture. The various blocks (and their abbreviation) are described in the text. The methods to connect them are shown over each wire. Color coding of the data flows refers to the pipeline type, as all pipelines run as instances (processes) of the pipeline host: blue for STU, red for the reference blink pipeline, green for IPP.
Current usage metrics show cumulative count of Article Views (full-text article views including HTML views, PDF and ePub downloads, according to the available data) and Abstracts Views on Vision4Press platform.
Data correspond to usage on the plateform after 2015. The current usage metrics is available 48-96 hours after online publication and is updated daily on week days.
Initial download of the metrics may take a while.