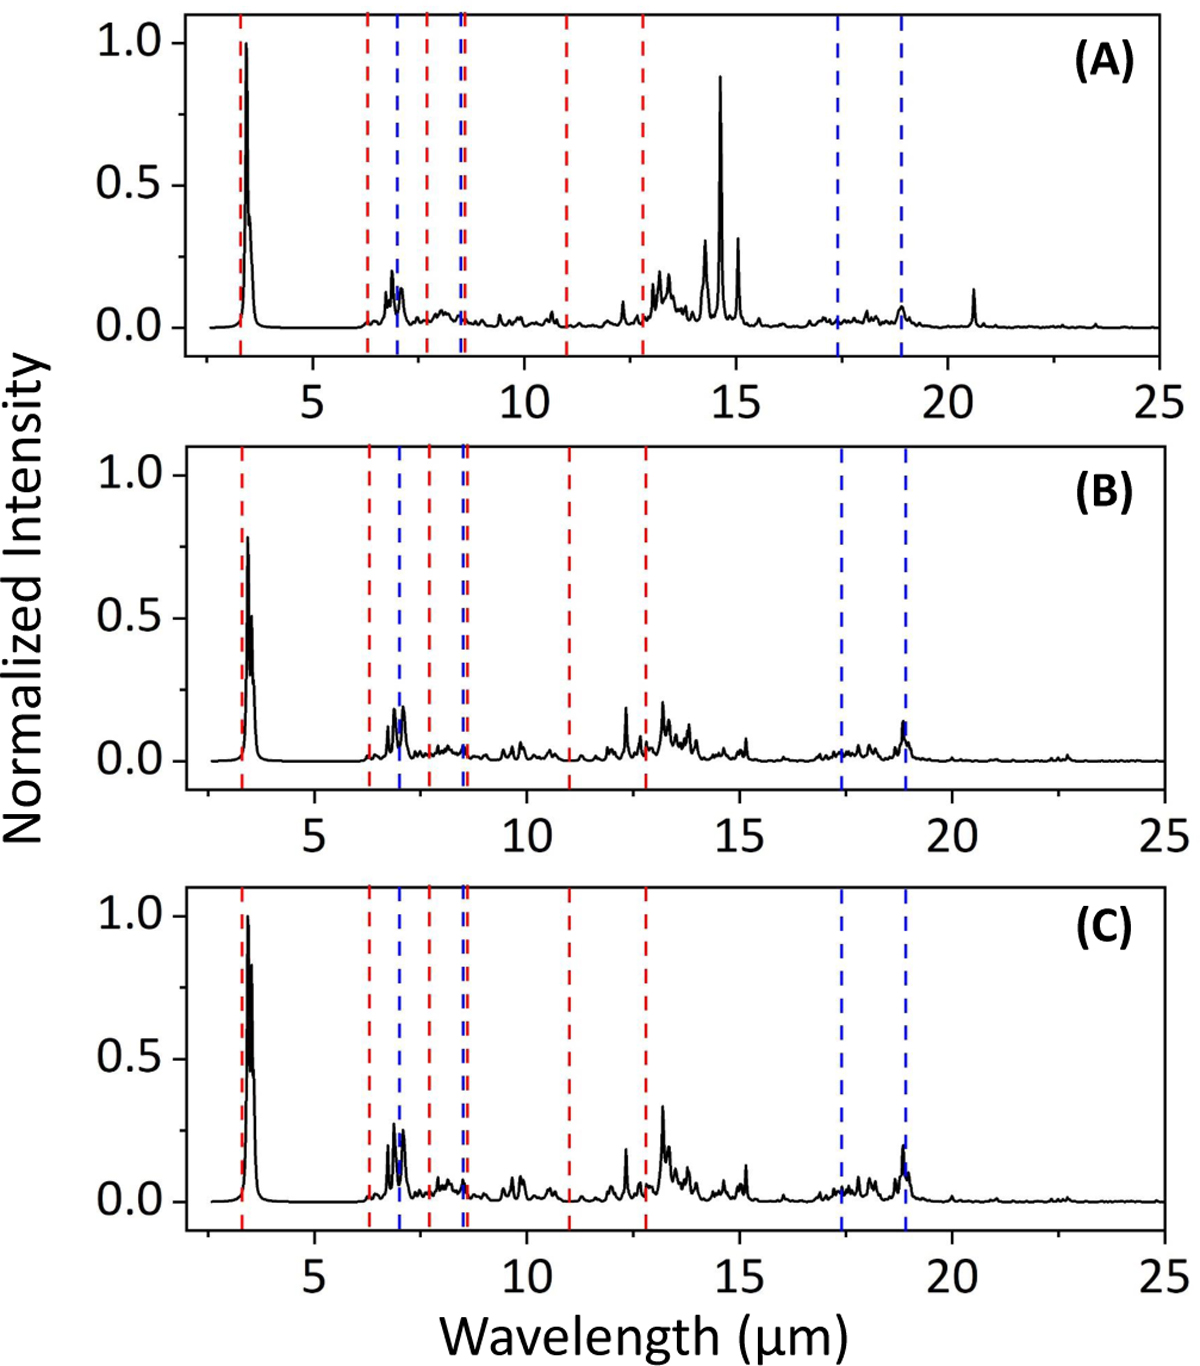
Fig. 6
Download original image
DFT-simulated IR (~3–25 μm) spectra of the mixture of PAH-C60 adducts. (A) Total (summed) mixture spectrum; (B): total abundance-weighted spectrum using the indene abundance from Burkhardt et al. (2021); and (C) total abundance-weighted spectrum using the indene abundance from Cernicharo et al. (2021). In all panels, the dashed red lines mark the most common astronomical PAH features (at ~3.3, 6.2, 7.7, 8.6, 11.2, and 12.7 μm), instead dashed blue lines mark the four strongest C60 features (~7.0, 8.5, 17.4, and 18.9 μm. In the case of the total (summed) mixture spectrum, the intensity has been normalized to the maximum intensity peak, while the abundance-weighted spectra have been normalized with respect to the higher intensity peak from the weighted spectrum (C); i.e., the one using the indene abundance from Cernicharo et al. (2021).
Current usage metrics show cumulative count of Article Views (full-text article views including HTML views, PDF and ePub downloads, according to the available data) and Abstracts Views on Vision4Press platform.
Data correspond to usage on the plateform after 2015. The current usage metrics is available 48-96 hours after online publication and is updated daily on week days.
Initial download of the metrics may take a while.