| Issue |
A&A
Volume 704, December 2025
|
|
|---|---|---|
| Article Number | A300 | |
| Number of page(s) | 20 | |
| Section | Atomic, molecular, and nuclear data | |
| DOI | https://doi.org/10.1051/0004-6361/202554031 | |
| Published online | 24 December 2025 | |
Peculiarities in the infrared emission of polycyclic aromatic hydrocarbon-C60 adducts
1
Departamento de Física and IUdEA, Universidad de La Laguna (ULL),
38200
Tenerife,
Spain
2
De Vinci Higher Education, De Vinci Research Center,
92 916
Paris,
France
3
Institut Supérieur des Arts Multimédia de la Manouba, Université de la Manouba,
2010
la Manouba,
Tunisia
4
Faculté des Sciences de Tunis, Département de Physique, (LPMC), Université de Tunis El Manar,
2092
Tunis,
Tunisia
5
Sorbonne Université, Observatoire de Paris, Université PSL, CNRS, LERMA,
92195
Meudon,
France
6
Instituto de Astrofísica de Canarias, C/ Via Láctea s/n,
38205
La Laguna,
Spain
7
Departamento de Astrofísica, Universidad de La Laguna (ULL),
38206
La Laguna,
Spain
8
Institut de Quimica Computacional i Catalisi (IQCC), Departament de Quimica, Universitat de Girona, Girona
17003,
Catalonia,
Spain
9
CIGUS CITIC – Department of Nautical Sciences and Marine Engineering, University of A Coruña,
Paseo de Ronda 51,
15011
A Coruña,
Spain
10
Consejo Superior de Investigaciones Científicas (CSIC),
Spain
11
Departament de Física Quàntica i Astrofísica (FQA), Universitat de Barcelona (UB),
c. Martí i Franqués, 1,
08028
Barcelona,
Spain
12
Institut de Ciències del Cosmos (ICCUB), Universitat de Barcelona (UB),
c. Martí i Franqués, 1,
08028
Barcelona,
Spain
13
Department of Physics, College of Khurma University, Taif University,
PO Box 11099,
Taif
21944,
Saudi Arabia
★ Corresponding author: This email address is being protected from spambots. You need JavaScript enabled to view it.
Received:
4
February
2025
Accepted:
25
October
2025
Abstract
The coexistence of polycyclic aromatic hydrocarbons (PAHs) and the C60 fullerene in different astrophysical environments can give rise to the formation of new complex species denoted as PAH-C60 adducts, which may contribute to the infrared (IR) emission observed. These PAH-C60 adducts have previously been reported experimentally due to the high reactivity between PAHs and C60. From an astrophysical point of view, however, they have not been considered in detail yet. Here, we performed a combined experimental and theoretical study in order to characterize the IR spectra of PAH-C60 adducts, including multiple adducts. Using new advanced experimental techniques, we were able to synthesize some specific PAH-C60 adduct isomers and measure their IR spectra. These experimental data were used to correct their harmonic scaled spectra, as obtained from quantum-chemistry calculations performed at the density functional theory (DFT) level under the B3LYP-GD3/6-31+G(d) approach. This way, we simulated the IR (~3–25 μm) spectra of multiple PAH-C60 adducts, composed by a different number of PAH units: mostly one or two units. In addition, the chemical kinetics data available in the literature were used to tentatively estimate the possible order of magnitude of the abundances of these PAH-C60 adducts using the available observational data. Essentially, our results revealed a possible strong modification of the IR spectra when astronomically estimated abundances are considered. Several spectral peculiarities are observed, such as a broad ~3.4–3.6 μm feature, and important modifications in the 6–10 and 12–16 μm spectral regions together with contributions to the C60 features at 7.0 and 18.9 μm. Interestingly, these PAH-C60 adducts lack aliphatic CH bonds, but they display IR features around 3.4 μm, challenging previous interpretations of this astronomical feature.
Key words: astrochemistry / stars: abundances / stars: carbon / infrared: stars
© The Authors 2025
 Open Access article, published by EDP Sciences, under the terms of the Creative Commons Attribution License (https://creativecommons.org/licenses/by/4.0), which permits unrestricted use, distribution, and reproduction in any medium, provided the original work is properly cited.
This article is published in open access under the Subscribe to Open model. This email address is being protected from spambots. You need JavaScript enabled to view it. to support open access publication.
1 Introduction
Fullerenes, such as C60, ![Mathematical equation: $\[\mathrm{C}_{60}^{+}\]$](/articles/aa/full_html/2025/12/aa54031-25/aa54031-25-eq1.png) , and C70, are the biggest molecules detected in space so far, either by their infrared (IR) emission bands or their visible absorption bands (Cami et al. 2010; Campbell et al. 2015). This especially concerns neutral C60, which has been detected via its IR transitions mainly in circumstellar envelopes of evolved stars such as young planetary nebulae (PNe) (Cami et al. 2010; García-Hernández et al. 2011b), but also in diverse astrophysical environments including R Coronae Borealis (RCB) stars (García-Hernández et al. 2011a), reflection nebulae (Sellgren et al. 2010), young stellar objects (Roberts et al. 2012), the diffuse interstellar medium (ISM; Berné et al. 2017), and, more recently, in regions related to protoplanetary disks (Iglesias-Groth 2019; Arun et al. 2023). The spectral signature of C60 is recognizable by its four strongest mid-IR emission bands at ~7.0, 8.5, 17.4, and 18.9 μm. According to these four bands, thermal models can be used to predict the C60 temperature in different astrophysical objects, especially in the case of circumstellar envelopes of evolved stars, where it has been estimated that an average temperature of ~300 K is representative of the C60 IR emission (Cami et al. 2011; García-Hernández et al. 2012b). In many of these astrophysical environments C60 is accompanied by other organic species, which potentially could react with C60, forming more complex molecular systems or C60 derivatives. In fact, Barzaga et al. (2023a) show that the variation of the C60 17.4 μm/18.9 μm band ratio observed in different C60-rich circumstellar envelopes (PNe and RCB stars) may imply that there are other species such as metallofullerenes, possibly among others, contributing at these wavelengths. This reinforces the idea of the possible presence of C60 derivatives in space environments. One of the most obvious candidate molecules to form C60 derivatives are polycyclic aromatic hydrocarbons (PAHs), which are detected in conjunction with C60 in very different fullerenerich sources (e.g.; García-Hernández et al. 2010; Sellgren et al. 2010; Otsuka et al. 2013; Arun et al. 2023).
, and C70, are the biggest molecules detected in space so far, either by their infrared (IR) emission bands or their visible absorption bands (Cami et al. 2010; Campbell et al. 2015). This especially concerns neutral C60, which has been detected via its IR transitions mainly in circumstellar envelopes of evolved stars such as young planetary nebulae (PNe) (Cami et al. 2010; García-Hernández et al. 2011b), but also in diverse astrophysical environments including R Coronae Borealis (RCB) stars (García-Hernández et al. 2011a), reflection nebulae (Sellgren et al. 2010), young stellar objects (Roberts et al. 2012), the diffuse interstellar medium (ISM; Berné et al. 2017), and, more recently, in regions related to protoplanetary disks (Iglesias-Groth 2019; Arun et al. 2023). The spectral signature of C60 is recognizable by its four strongest mid-IR emission bands at ~7.0, 8.5, 17.4, and 18.9 μm. According to these four bands, thermal models can be used to predict the C60 temperature in different astrophysical objects, especially in the case of circumstellar envelopes of evolved stars, where it has been estimated that an average temperature of ~300 K is representative of the C60 IR emission (Cami et al. 2011; García-Hernández et al. 2012b). In many of these astrophysical environments C60 is accompanied by other organic species, which potentially could react with C60, forming more complex molecular systems or C60 derivatives. In fact, Barzaga et al. (2023a) show that the variation of the C60 17.4 μm/18.9 μm band ratio observed in different C60-rich circumstellar envelopes (PNe and RCB stars) may imply that there are other species such as metallofullerenes, possibly among others, contributing at these wavelengths. This reinforces the idea of the possible presence of C60 derivatives in space environments. One of the most obvious candidate molecules to form C60 derivatives are polycyclic aromatic hydrocarbons (PAHs), which are detected in conjunction with C60 in very different fullerenerich sources (e.g.; García-Hernández et al. 2010; Sellgren et al. 2010; Otsuka et al. 2013; Arun et al. 2023).
The PAHs are largely assumed to be responsible for the discrete unidentified IR (UIR) emission bands at ~3.3, 6.2, 7.7, 8.6, and 11.2 μm widely observed in the Universe, from our Solar System to old stars and very distant galaxies, among others (see, e.g. Peeters et al. 2021, 2024 and Chown et al. 2024, for a recent review and a comprehensive study of the Orion Bar). According to astrophysical models, the UIR emission bands can be attributed to large-dimension PAHs composed of ~25–100 C atoms (e.g.; Allamandola et al. 1989; Puget & Léger 1989; Chown et al. 2024). Indeed, a family of large PAHs (neutrals and ions) have to be randomly combined in order to reproduce the UIR bands (e.g.; in terms of the broadness of the features; Rosenberg et al. 2014)1. However, such large PAHs have not yet been unambiguously detected in space, neither in the ISM nor any other astrophysical environment. In contrast, recent detections of small cyano-PAHs such as cyanonaphtalene (McGuire et al. 2021) and the pure PAH indene (Burkhardt et al. 2021; Cernicharo et al. 2021), toward the cold dark cloud TMC-1, confirm for the first time the presence of these species in space. These detections are only possible by radioastronomy, combined with microwave spectroscopy measurements, being the first convincing evidences of the existence of small PAHs in astronomical environments2.
The C60 and PAH molecules can easily react to form new hybrid species denoted as C60 adducts3, which are obtained by well-known organic-chemistry experimental procedures (e.g.; Sarova & Berberan-Santos 2004; García-Hernández et al. 2013b; Dunk et al. 2013; Barham et al. 2018). In particular, these methods have been employed to synthesize C60 adducts with acenes (anthracene, tetracene, pentacene), as well as with indene. The formation reaction of such C60 adducts occurs smoothly, yielding single-to-multiple PAHs attached to the C60 cage (see, e.g.; He et al. 2010; Cataldo et al. 2014). This provokes the production of a mixture of regioisomers4, which is the main drawback, especially for their IR spectra measurements. However, a recent study reported the use of a supramolecular mask strategy in order to perform regioselective synthesis of anthracene and pentacene C60 bis-adducts (Pujals et al. 2022). This novel strategy allows us to pinpoint the selection of the desired PAH isomers, even for multiple addend PAH units to the carbon cage (see Pujals et al. 2022, for more details). In short, all previous experimental studies clearly show the trend of C60 to easily form adducts under the presence of these small PAHs, something that it is very likely to also occur in astrophysical environments under UV-shielding conditions such as evolved stars, where both types of organic ingredients may coexist.
Herein, we present a quantum-chemical study, supported by novel experimental data, of multiple C60 adducts with the small PAHs indene, indenyl, anthracene, tetracene, and pentacene. Mono-adduct models are reported for all these PAHs, while the bis- and tris-adduct models are only included for the small PAHs indene, indenyl, and anthracene. Their IR spectra have been simulated in order to capture the structural effects of the multiple addend PAH units and their relation with the IR spectral features observed. For this purpose, reliable scaling factors have previously been obtained and validated using the advanced, experimental IR-spectra measurements available for these C60 adducts. Several spectral peculiarities are seen in the simulated IR spectra of multiple PAH-C60 adducts, which are made publicly available to the astrophysical community, especially to users of the James Webb Space Telescope (JWST), for potential comparisons with their astronomical observations.
2 Methods
Quantum-chemistry models of PAH-C60 adducts required an accurate description of the numerous-electron system composing these molecules. The approach selected to carry out these quantum-chemical calculations is mainly determined by the number of electrons in the system. The density functional theory (DFT) is the natural choice to model large molecules containing more than 100 electrons. The PAH-C60 adducts presented here contain up to ~650 electrons, which corresponds to the maximum PAH units of anthracene added to C60. The large system size thus makes the treatment of our models with more accurate quantum-chemical approaches other than DFT unfeasible; e.g.; ab initio methods.
2.1 Computational details
The Gaussian16 code (Frisch et al. 2016) was used to perform all the DFT calculations, in conjunction with the double zeta 6-31+G(d) basis set (Petersson et al. 1988; Petersson & Al-Laham 1991). Similarly to previous works on other PAH-C60 adducts, the B3LYP functional (Stephens et al. 1994) has been chosen to describe the exchange and electronic correlation (Beheshtian et al. 2012; Khodam Hazrati & L. Hadipour 2016; El Bakouri et al. 2018). Large aromatic molecules including PAHs and C60 can exhibit strong, long-range forces (London forces) when they interact with each other (Ehrlich et al. 2013). In order to account for such forces, the third-level empirical dispersion correction of Grimme (GD3) has also been included in the calculations (Grimme et al. 2010). Each PAH-C60 adduct, after full optimization, was verified as a stationary point with non-imaginary vibrations to be considered as a minimum. A thermodynamic analysis for all the PAH-C60 adducts was conducted at 300 K, along with the corresponding zero-point energy correction.
The IR vibrational spectra of all species were obtained within the framework of the harmonic oscillator and, subsequently, the harmonic frequencies were adjusted by applying a triple-scaling-factor scheme to account for anharmonicity, vibro-rotational couplings, and so on. (see next section). The IR intensity was modeled by a Lorentzian function as a peak profile and with a full width at half maximum (FWHM) of 0.02 μm. This approximately reproduces the average spectral resolution (R~1700) of the Mid-IR Instrument (MIRI) onboard the JWST, working in the ~5–30 μm spectral range. One of our goals is to provide the theoretically simulated IR spectra of PAH-C60 adducts to the astronomical community as an useful tool to interpret JWST observational data.
2.2 Scaling factors
The predicted harmonic frequencies from quantum-chemical calculations must be corrected with scaling factors to avoid the overestimation with respect to the experimental fundamentals (Zapata Trujillo & McKemmish 2022a). Generally, scaling factors are determined by a fitting procedure of the theoretical IR spectral data against the experimental ones (see, e.g.; Xu et al. 2023). In our case, we lack experimental data for all PAH-C60 adducts under study and the standard procedure for the scaling factors fitting is not possible. Thus, we applied an extrapolation method to existing scaling factors depending on the PAH type bonded to the C60 cage and based on the equation
![Mathematical equation: $\[\nu_i \simeq \mathrm{SF}_a \cdot \omega_i,\]$](/articles/aa/full_html/2025/12/aa54031-25/aa54031-25-eq2.png) (1)
(1)
where νi and ωi stand for experimental and theoretical frequencies, respectively, with the ith suffix indicating that they correspond to the same normal mode and SFa being the scaling factor. The Eq. (1) above can be reformulated as
![Mathematical equation: $\[\nu_i \simeq \mathrm{SF}_a \cdot \omega_i=\mathrm{SF}_a^{\prime} \cdot \omega_i^{\prime},\]$](/articles/aa/full_html/2025/12/aa54031-25/aa54031-25-eq3.png) (2)
(2)
where Eq. (2) describes the relation between harmonic frequencies obtained from different quantum-chemical calculations and is fulfilled if the two sets of harmonic frequencies (![Mathematical equation: $\[\omega_{i}, \omega_{i}^{\prime}\]$](/articles/aa/full_html/2025/12/aa54031-25/aa54031-25-eq4.png) ) are obtained at the same level of theory, thus producing scaling factors (
) are obtained at the same level of theory, thus producing scaling factors (![Mathematical equation: $\[\mathrm{SF}_{a}, \mathrm{SF}_{\mathrm{a}}^{\prime}\]$](/articles/aa/full_html/2025/12/aa54031-25/aa54031-25-eq5.png) ) that achieve a good agreement with the experimental values (νi). Formally, the accuracy of harmonic frequencies not only depends on the level of theory used, but also on the basis set applied in the description of the quantum-chemistry model (Zapata Trujillo & McKemmish 2022a,b). However, recent theoretical studies demonstrate that the median error in the obtained harmonic frequencies with respect to their experimental fundamental vibrations depends more on the level of theory selected than on the basis set applied (Zapata Trujillo & McKemmish 2023). On the other hand, the scaling factors can correct the harmonic frequencies by applying a global (single number) scaling factor or a frequency-range-specific (multiple numbers) scaling factor. Frequency-range-specific scaling factors exhibit higher accuracy than their global counterparts, which is due to the frequency range division performed. The frequency range is usually divided into three different frequency regions, each one of them with its corresponding scaling factor (Zapata Trujillo & McKemmish 2023).
) that achieve a good agreement with the experimental values (νi). Formally, the accuracy of harmonic frequencies not only depends on the level of theory used, but also on the basis set applied in the description of the quantum-chemistry model (Zapata Trujillo & McKemmish 2022a,b). However, recent theoretical studies demonstrate that the median error in the obtained harmonic frequencies with respect to their experimental fundamental vibrations depends more on the level of theory selected than on the basis set applied (Zapata Trujillo & McKemmish 2023). On the other hand, the scaling factors can correct the harmonic frequencies by applying a global (single number) scaling factor or a frequency-range-specific (multiple numbers) scaling factor. Frequency-range-specific scaling factors exhibit higher accuracy than their global counterparts, which is due to the frequency range division performed. The frequency range is usually divided into three different frequency regions, each one of them with its corresponding scaling factor (Zapata Trujillo & McKemmish 2023).
Following the concepts mentioned above to obtain new scaling factors for the PAH-C60 adducts, we applied Eq. (2) in combination with the frequency-range-specific scaling factors (at <5 μm, 5–10 μm and >10 μm) from the NASA Ames PAH IR Spectroscopic Database (e.g.; Bauschlicher et al. 2018; Boersma et al. 2014; Mattioda et al. 2020, AMES PAH database hereafter). The frequency-range-specific scaling factors of the AMES PAH Database have been computed at the 4-31G/B3LYP level for a large variety of PAH molecules, including the set of small PAHs of interest to us (see Figure 1)5. In addition to our standard 6-31+G(d)/B3LYP+GD3 approach, we also computed the resulting harmonic frequencies at the 6-31+G(d)/B3LYP level only. The main purpose is to account for the effect of the dispersion correction (GD3) over the scaling factors.
Table 1 summarizes the comparison of frequency-range-specific scaling factors obtained through Eq. (2) with respect to those of the AMES PAH Database (Bauschlicher et al. 2018; Boersma et al. 2014; Mattioda et al. 2020). The new scaling factors ![Mathematical equation: $\[\mathrm{SF}_{3}^{\text {B3LYP}}\]$](/articles/aa/full_html/2025/12/aa54031-25/aa54031-25-eq15.png) and
and ![Mathematical equation: $\[\mathrm{SF}_{3}^{\mathrm{D} 3}\]$](/articles/aa/full_html/2025/12/aa54031-25/aa54031-25-eq16.png) provide the same level of accuracy, which is clearly reflected in the maximum relative error (Max.r.e.)6; they are very similar for both methods. The Max.r.e indicates the deviation of the scaled frequencies obtained from
provide the same level of accuracy, which is clearly reflected in the maximum relative error (Max.r.e.)6; they are very similar for both methods. The Max.r.e indicates the deviation of the scaled frequencies obtained from ![Mathematical equation: $\[\mathrm{SF}_{3}^{\text {B3LYP}}\]$](/articles/aa/full_html/2025/12/aa54031-25/aa54031-25-eq17.png) and
and ![Mathematical equation: $\[\mathrm{SF}_{3}^{\mathrm{D} 3}\]$](/articles/aa/full_html/2025/12/aa54031-25/aa54031-25-eq18.png) with respect to those of
with respect to those of ![Mathematical equation: $\[\mathrm{SF}_{3}^{\mathrm{AMES}}\]$](/articles/aa/full_html/2025/12/aa54031-25/aa54031-25-eq19.png) . Our new scaling factors mostly have a Max.r.e of ~10−2, with a slightly larger value (~5×10⁻²) at wavelengths longer than 10 μm (see Table 1). However, the spectral resolution of the experimental IR spectra used to obtain the AMES PAH database scaling factors
. Our new scaling factors mostly have a Max.r.e of ~10−2, with a slightly larger value (~5×10⁻²) at wavelengths longer than 10 μm (see Table 1). However, the spectral resolution of the experimental IR spectra used to obtain the AMES PAH database scaling factors ![Mathematical equation: $\[\mathrm{SF}_{3}^{\mathrm{AMES}}\]$](/articles/aa/full_html/2025/12/aa54031-25/aa54031-25-eq20.png) is significantly higher than our Max.r.e. values (see, e.g.; Mattioda et al. 2020). So, the error introduced by the new scaling factors
is significantly higher than our Max.r.e. values (see, e.g.; Mattioda et al. 2020). So, the error introduced by the new scaling factors ![Mathematical equation: $\[\mathrm{SF}_{3}^{\text {B3LYP}}\]$](/articles/aa/full_html/2025/12/aa54031-25/aa54031-25-eq21.png) and
and ![Mathematical equation: $\[\mathrm{SF}_{3}^{\mathrm{D} 3}\]$](/articles/aa/full_html/2025/12/aa54031-25/aa54031-25-eq22.png) can be considered as negligible. In short, we conclude that both scaling factors
can be considered as negligible. In short, we conclude that both scaling factors ![Mathematical equation: $\[\mathrm{SF}_{3}^{\text {B3LYP}}\]$](/articles/aa/full_html/2025/12/aa54031-25/aa54031-25-eq23.png) and
and ![Mathematical equation: $\[\mathrm{SF}_{3}^{\mathrm{D} 3}\]$](/articles/aa/full_html/2025/12/aa54031-25/aa54031-25-eq24.png) can reproduce the vibrational frequencies (or IR features) of the small PAHs displayed in Figure 1 fairly well. In the following, we only use the scaled frequencies as obtained from the new scaling factors
can reproduce the vibrational frequencies (or IR features) of the small PAHs displayed in Figure 1 fairly well. In the following, we only use the scaled frequencies as obtained from the new scaling factors ![Mathematical equation: $\[\mathrm{SF}_{3}^{\mathrm{D} 3}\]$](/articles/aa/full_html/2025/12/aa54031-25/aa54031-25-eq25.png) .
.
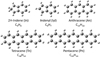 |
Fig. 1 Structure of several PAHs considered to build PAH-C60 adducts. The chemical formula, name, and notations are also displayed. |
2.3 Validation scaling factors
Despite the scaling factors ![Mathematical equation: $\[\mathrm{SF}_{3}^{\mathrm{D} 3}\]$](/articles/aa/full_html/2025/12/aa54031-25/aa54031-25-eq26.png) reliably reproduce the experimental IR features of small PAHs (Fig. 1), here we are interested in their adducts with the C60 molecule. Therefore, it is not appropriate to directly extrapolate our
reliably reproduce the experimental IR features of small PAHs (Fig. 1), here we are interested in their adducts with the C60 molecule. Therefore, it is not appropriate to directly extrapolate our ![Mathematical equation: $\[\mathrm{SF}_{3}^{\mathrm{D} 3}\]$](/articles/aa/full_html/2025/12/aa54031-25/aa54031-25-eq27.png) scaling factors to PAH-C60 adducts before a proper validation. In order to validate our scaling factors, we used the laboratory IR spectra measurements of three different types of PAH-C60 adducts (see Figure 2). These three archetypal systems were synthesized via a novel supramolecular mask strategy (Pujals et al. 2022), which allowed us to selectively obtain the bis-adducts (two PAH units) or mono-adducts (one PAH unit). It is worth noting that the synthesis route via supramolecular mask strategy can pinpoint to the desired PAH-C60 adduct isomer. Thus, we were completely confident that the laboratory IR spectra were not contaminated by a mixture of regioisomers.
scaling factors to PAH-C60 adducts before a proper validation. In order to validate our scaling factors, we used the laboratory IR spectra measurements of three different types of PAH-C60 adducts (see Figure 2). These three archetypal systems were synthesized via a novel supramolecular mask strategy (Pujals et al. 2022), which allowed us to selectively obtain the bis-adducts (two PAH units) or mono-adducts (one PAH unit). It is worth noting that the synthesis route via supramolecular mask strategy can pinpoint to the desired PAH-C60 adduct isomer. Thus, we were completely confident that the laboratory IR spectra were not contaminated by a mixture of regioisomers.
The experimental IR spectra of the three PAH-C60 adducts in Figure 2 were obtained by a Bruker ALPHA II FT-IR spectrometer with a spectral resolution of ±2 cm−1 equipped with a DTGS (deuterated triglycine sulfate) detector. All measurements were carried out in the solid state of the sample using a Bruker Platinum ATR adapter (attenuating total reflectance module with a diamond crystal support), allowing a direct measurement without prior treatment of the sample. All spectra were recorded at room temperature and under air atmosphere. The FT-IR measurements were recorded between 2.5 and 25 μm (4000–400 cm−1). Each final spectrum was obtained by averaging 24 recorded scans.
In order to quantitatively assess the agreement between the experimental and theoretical IR spectra, we have followed the procedure of the cosine similarity score recently introduced in the literature (Fu & Hopkins 2018; Kempkes et al. 2019; Müller et al. 2020). This similarity score method calculates the cosine of the angle θ between two n-dimensional vectors using their normalized Euclidean dot product according to
![Mathematical equation: $\[\text { Similarity }=\cos (\theta)=\frac{\mathrm{A} \cdot \mathrm{~B}}{\|\mathrm{~A}\|\|\mathrm{B}\|}=\frac{\sum_{i=1}^n A_i B_i}{\sqrt{\sum_{i=1}^n A_i^2} \cdot \sqrt{\sum_{i=1}^n B_i^2}}.\]$](/articles/aa/full_html/2025/12/aa54031-25/aa54031-25-eq28.png) (3)
(3)
Here, the elements Ai and Bi are the experimental (A) and theoretical (B) IR intensity at the same i th frequency. Concretely, the procedure is to compute the similarity score at the same reference frequency; both experimental and theoretical spectra thus have the same x-axis. In this case, the experimental spectrum is taken as reference and the similarity score was calculated at the exact experimental wavenumber. A similarity score close to one indicates a higher resemblance between the experimental and theoretical spectra.
On the other hand, Kempkes et al. (2019) introduce an alternative definition of the IR intensity to make the cosine similarity score more sensitive to the overlap of frequencies in spectra A and B of Eq. (3), but diminishing the importance in the deviations of their IR intensities (see Kempkes et al. 2019, for more details). The Kempkes et al. (2019) IR intensity definition stands as
![Mathematical equation: $\[A_i^{r e v}=\log \left(\frac{A_i}{A_m}+c\right).\]$](/articles/aa/full_html/2025/12/aa54031-25/aa54031-25-eq29.png) (4)
(4)
The variable ![Mathematical equation: $\[A_{i}^{rev}\]$](/articles/aa/full_html/2025/12/aa54031-25/aa54031-25-eq30.png) denotes a new recalculated intensity, which is computed from the normalized intensity up to a maximum of
denotes a new recalculated intensity, which is computed from the normalized intensity up to a maximum of ![Mathematical equation: $\[1 \equiv(\frac{A_{i}}{A_{m}})\]$](/articles/aa/full_html/2025/12/aa54031-25/aa54031-25-eq31.png) and weighted by a factor c. We applied this procedure (Eq. (4)) to both the experimental (A) and theoretical (B) IR spectra, compromising the similarity score with the sensitivity to low-intensity bands in the spectrum, but avoiding the experimental noise. The factor, c, is a constant for both A and B that has to be derived from the correlation between the experimental and theoretical spectra. However, due to the lack of a significant number of resolved IR features (i.e., poor statistics) in our PAH-C60 adducts experimental spectra (Fig. 3), we did not correlate them with the theoretical ones. Instead, we used a factor of c = 0.71 recently reported by Xu et al. (2023), as obtained from a significant number of experimentally resolved IR features on smaller C60 adducts such as C60O+ and C60H+. This way, the recalculated experimental and theoretical intensities,
and weighted by a factor c. We applied this procedure (Eq. (4)) to both the experimental (A) and theoretical (B) IR spectra, compromising the similarity score with the sensitivity to low-intensity bands in the spectrum, but avoiding the experimental noise. The factor, c, is a constant for both A and B that has to be derived from the correlation between the experimental and theoretical spectra. However, due to the lack of a significant number of resolved IR features (i.e., poor statistics) in our PAH-C60 adducts experimental spectra (Fig. 3), we did not correlate them with the theoretical ones. Instead, we used a factor of c = 0.71 recently reported by Xu et al. (2023), as obtained from a significant number of experimentally resolved IR features on smaller C60 adducts such as C60O+ and C60H+. This way, the recalculated experimental and theoretical intensities, ![Mathematical equation: $\[A_{i}^{rev}\]$](/articles/aa/full_html/2025/12/aa54031-25/aa54031-25-eq32.png) and
and ![Mathematical equation: $\[B_{i}^{rev}\]$](/articles/aa/full_html/2025/12/aa54031-25/aa54031-25-eq33.png) , are used in Eq. (3) to compute the similarity score values for the three archetypal PAH-C60 adducts and indicated in the legend of Fig. 3.
, are used in Eq. (3) to compute the similarity score values for the three archetypal PAH-C60 adducts and indicated in the legend of Fig. 3.
In Figure 3a, we show that the scaled harmonic theoretical IR spectra of our three archetypal PAH-C60 adducts are in good agreement with the experimental spectra regarding the vibrational frequencies. This is evidenced by the similarity scores obtained, which resemble those reported in previous experimental-theoretical studies (Müller et al. 2020; Kempkes et al. 2019). However, according to our experimental spectra, the archetypal PAH-C60 adducts do not display IR features below ~3.3 μm (above 3000 cm−1). Apparently, our scaling factors produced from free PAHs could not reproduce this spectral region for PAH-C60 adducts. Thus, we opted to apply an empirical correction to the scaling factors in Table 1, but only in the <5 μm spectral range. The procedure implied a shift of the theoretical spectra until a maximum in the similarity score was obtained with respect to the experimental data. Figure 3b illustrates the empirical-corrected theoretical spectra this way, showing an ~3.3 μm region in better agreement with the experimental data. Using these three archetypal PAH-C60 adducts, we found an empirical wavelength correction of 0.1984 μm, which was applied to the scaling factors for the rest of PAH-C60 adducts. The corresponding scaling factors finally adopted can be found in Appendix A. It is worth noting that the experimental spectra of the pristine PAHs and PAH-C60 adducts were significantly different in the ~3.3–3.6 μm region (see Figure 3b); this is discussed in the following sections.
However, deviations in the intensities were noticeable, especially in the case of 2AnC60, which showed the largest intensity deviations of the three PAH-C60 adducts (e.g.; at wavelengths longer than 7 μm but also in the ~3.3–3.5 μm spectral region). The difference in intensity between the theoretical and experimental IR spectra was likely due to several causes. The collection of the experimental spectra was performed in a solid state, which can modify the IR intensity with respect to gas-phase measurements such as IR multiple-photon dissociation (IRPMD; Polfer 2011; Palotás et al. 2020) or even more sophisticated techniques (Gerlich et al. 2018; Roithová et al. 2016). In addition, we could not completely discard whether a better fitting of the experimental spectra baseline and/or a reduction of the noise contribution could improve the intensity match with the theoretical spectra. Nevertheless, we note that the experimental measurements of the three archetypal PAH-C60 adducts were only used to validate our new derived scaling factors (see Table 1 and Appendix A), which, according to the similarity score values, perform quite well regarding the vibrational IR frequencies. The intensity mismatch is a long-standing and well-known problem in the comparison of experimental and theoretical IR spectra of complex organic compounds (see, e.g.; Katsyuba et al. 2013), and its resolution is of course beyond the scope of the present work.
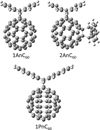 |
Fig. 2 Three archetypal PAH-C60 adducts synthesized by supramolecular mask strategy and used for the scaling factors’ validation: 1AnC60 (mono-anthracene), 2AnC60 (bis-anthracene), and 1PnC60 (monopentacene) (see Pujals et al. 2022, for more details). The notation follows the legend in Figure 1, adding the number of PAH units and the C60 identification. |
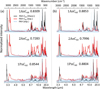 |
Fig. 3 Experimental (red) versus scaled harmonic B3LYP-D3/6-31+G* (black) spectra for the three archetypal PAH-C60 adducts used for the scaling factors’ validation: 1AnC60, 2AnC60, and 1PnC60 (Fig. 2). The experimental spectra of the pristine PAHs (light blue) are included to ease the discussion. (a) Spectra built from scaling factors in Table 1. (b) Spectra built from empirical-corrected scaling factors for wavelengths <5 μm (>2000 cm−1) (see the text for more details). The similarity score value for each case is also indicated. The theoretical spectra were constructed in the wavenumber scale by the convolution of a Lorentzian function with FWHM = 4 cm−1 in order to ease the comparison with the experimental spectra. |
3 Comparison of PAH-C60 adducts
In the following section, we present the theoretical models and simulated IR spectra of several PAH-C60 adducts containing multiple PAH units; in many cases they were described by more than one spatial configuration (isomers). The mono-adduct’s notation refers to the C60 adducts formed by the addition of one PAH unit only, while bis-adducts and tris-adducts stand for two and three PAH units, respectively. For the largest PAHs considered here, tetracene (Tn) and pentacene (Pn) (see Figure 1), only a maximum of two units and one unit, respectively, were attached to the C60 cage; mainly due to our computational limitations.
Figure 4 displays the theoretical IR spectra of the different mono-adduct models together with their molecular structure. At first glance, the IR spectra of the mono-adducts are richer than those corresponding to the isolated PAH and C60 molecules (Figure 4), especially in those spectral regions (e.g.; the ~12–13 and 14–17.5 μm regions, among others; see Figure 4 and Appendix F) where no contributions from the corresponding PAH and C60 are observed. In addition, the typical ~3.3 μm feature of the pristine PAH appeared redshifted in the case of PAH-C60 adducts. The PAH binding to the C60 cage was the cause of all new emission features observed in the IR spectra, denoting several unique spectral regions to distinguish PAH-C60 mono-adducts. The black arrows in Figure 4 also indicate specific features that were free of contribution from C60, the pristine PAH, and even from the other adducts. In some adducts, such as those with In and Iyl, it was very difficult to identify unique (specific of the adduct) features since they contributed throughout all the IR spectra. The peculiarities of In or Iyl adducts were due to the multiple possible ways of binding to the C60 cage. Single and double-bond bindings have also been found in previous studies of C60-coronene+ adducts, but in this case inducing the loss of one or two H atoms, which can be another type of binding between PAHs and C60 reacting under energetic conditions (see Figure 2 in Dunk et al. 2013). In contrast, the rest of the mono-adducts could only be obtained under a double-bonded geometry (see Figure 4). Nevertheless, all mono-adducts had common emitting spectral regions with features at ~3.3–3.6, 6–10, 12–16, and 17–19 μm.
The 3.3–3.6 μm feature became broader (or split into various peaks) and less intense as the size of the PAH attached to the C60 cage decreases (see Appendix F). The former trend was only an indication of the reduction in the number of CH bonds and a breakdown of the symmetry as the PAH is smaller. Fewer CH bonds reduced the intensity of the 3.3–3.6 μm feature, while asymmetric PAHs as In and Iyl made the feature broader (or even with additional resolved features at slightly longer wavelengths of ~3.5–3.6 μm) because of the different chemical environments affecting the CH bonds7. In fact, In and Iyl showed a clear increase in the IR intensity of the CH stretching region when the PAHs were bonded through the pentagon ring; this was a consequence of a more marked dipole moment change for the CH vibrations inside the pentagon than for the hexagon.
At 6–10 μm the trend was similar in all spectra, a number of new low-intensity IR features, with 1InC60′ being the spectrally richer model (see Figure 4). The CC vibrations lie in this region, which, as expected, showed the major coincidence (in terms of features) with its progenitors: the free PAHs, and the C60 cage. In particular, all mono-adducts strongly contributed to the 7.0 μm C60 feature, with an almost negligible emission contribution at 8.5 μm. The enrichment of the IR spectra in the 6–10 μm spectral region was smaller than for other fullerene-based species like metallofullerenes (Barzaga et al. 2023a,b). This indicated that the dipole moment change related to CC vibrations was weakly modified by the binding between the PAHs and C60. Consequently, charge reordering and charge-transfer processes in the mono-adducts were less important than for metallofullerenes (Barzaga et al. 2023b).
The 12–16 μm spectral region was very interesting because it is free from C60 emission, and the isolated PAHs usually only displayed one strong feature around ~13–14 μm, but their mono-adduct counterparts display richer spectra. This region was mainly dominated by the out-of-plane CH vibrations, and it was less IR active when the PAH was alone. In the particular case of 2H-indene (In) and indenyl (Iyl), the PAH can be binded to the C60 cage through its hexagon or pentagon ring8 (see Figure 4). Both In and Iyl binded more favorably to the C60 cage through the pentagon ring with energies of −1.62 eV (1InC60′) and −1.41 eV (1IylC60*), respectively. This specific binding was also reflected in the change of the IR spectra in the 12–16 μm region, with the appearance of new IR active features. On the other hand, in the case of Iyl singly bonded to the C60 (1IylC60*, marked with a green arrow in Figure 4), multiple out-of-plane CH vibrations became IR active. This was due to the loss of symmetry compared to the doubled-bonded 1IylC60′ model; the vibrational modes appear split, producing a richer spectra in the 12–16 μm range.
Finally, another interesting spectral region was the one from 17 to 19 μm. This region looks quite similar in the mono-adducts, with several new weak features emerging around 17.4 μm and a broader 18.7–19.2 μm peak whose strongest intensity was at 18.9–19.0 μm. Clearly, this implied an important contribution to the 18.9 μm C60 feature, with only a marginal emission contribution at 17.4 μm, where there was a marked decay in intensity (see Appendix F). The 18.9 μm feature of pristine C60 corresponds to a combined carbon cage vibration, but the symmetry is destroyed by PAH binding9. Curiously, the largest mono-adducts from Tn and Pn were the only ones exhibiting noticeable IR features at wavelengths >20 μm; in particular, 1PnC60 had a relatively strong feature at 20.7 μm. These features at long wavelengths were intrinsic to the free PAHs, although they were perturbed by the binding to C60, causing a shift in wavelength up to ~0.8 μm in the case of Tn (see Figure 4).
Figure 5 shows a comparison between the theoretical scaled IR spectra of mono-adducts and bis-adducts, indicating that no significant differences are observed. The changes from mono- to bis-adducts were only in terms of IR intensity caused by the increment of PAHs units, but regarding the features position, the spectra remain unchangeable. The only exception was for the model 2IylC60 h, and it was provoked by a strong structural deformation of the C60 cage (see Appendices B and F for more details). Furthermore, the same spectral behavior was observed for the tris-adducts when they were compared with the bis-adducts (see Appendix C). The spectral differences among all these PAH-C60 adducts were more appreciated at low IR intensity; in most cases, they were expected to be well below the detection threshold of astronomical IR observations (see Appendices B and C).
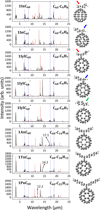 |
Fig. 4 Scaled theoretical IR spectra of mono PAH-C60 adducts (one PAH unit: C60-CxHy) modeled at the B3LYP-D3/6-31+G* level. All spectra were convolved with a Lorentzian function of FWHM = 0.02 μm. In the case of 2H-indene (In) and indenyl (Iyl), the blue and red arrows highlight the binding of the PAH with a pentagon and hexagon ring to the C60 cage, respectively. For indenyl, with a single bond connecting its pentagon to C60, a green arrow has been used instead. In all panels, the dashed red spectra correspond to the isolated pristine PAH, while the dashed blue lines mark the four strongest C60 features (~7.0, 8.5, 17.4, and 18.9 μm). The black arrows on the spectra indicate those characteristic features (specific of each adduct), which are free of contribution from C60, the pristine PAH and even from the other adducts. |
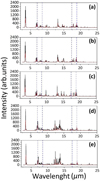 |
Fig. 5 Theoretical scaled IR spectra of PAH-C60 bis-adducts from 2H-indene (2InC60, a–c) and indenyl (2IylC60, d and e). The dashed red spectra correspond to the mono-adduct analogues, while the dashed blue lines mark the four strongest C60 features (~7.0, 8.5, 17.4, and 18.9 μm). Note that the convolution parameters are the same as in Figure 4. For a detailed discussion on the models and spectral features we refer to Appendix B. |
4 PAH-C60 adducts’ stability and kinetics
4.1 Thermodynamic stability
The common mechanism for the formation of C60 adducts is the exohedral addition of new molecular species – especially alkyl or benzyl groups – which is due to the high reactivity of C60 (Hirsch 1995; Krusic et al. 1991; Li 2022). We cannot confirm or refute that exohedral addition is the appropriate chemical process taking place in C60-rich astrophysical environments such as young PNe, characterized by both low temperatures (~300 K; see, e.g.; Cami et al. 2010; García-Hernández et al. 2012b) and densities; however, it is the one most likely taking into consideration the well-known C60 reactivity. In our case, multiple PAHs’ addends may undergo this exohedral cyclo-addition through sequential reaction pathways:
PAH+C60 → PAH-C60,
![Mathematical equation: $\[\mathrm{PAH}+\mathrm{PAH}-\mathrm{C}_{60} \xrightarrow{+\mathrm{PAH}}[\mathrm{PAH}]_{2}-\mathrm{C}_{60}\]$](/articles/aa/full_html/2025/12/aa54031-25/aa54031-25-eq34.png) ,
,![Mathematical equation: $\[\mathrm{PAH}+[\mathrm{PAH}]_{2}-\mathrm{C}_{60} \xrightarrow{+\mathrm{PAH}}[\mathrm{PAH}]_{3}-\mathrm{C}_{60}\]$](/articles/aa/full_html/2025/12/aa54031-25/aa54031-25-eq35.png) .
.
The three pathways (I-III) imply the sequential (step-by-step) addition of PAHs to C60 from mono- to tris-adducts. These reactions depend on different factors that determine the mechanism of formation, but also lack the description of UV radiative processes, which are commonly observed in many astrophysical sources, including C60-rich environments. Such an analysis requires a detailed description of several reaction pathways with the inclusion of photo-dissociation and photo-reaction, which involves the development of precise reactivity models, something that is extensively time-consuming and beyond of the scope of the present work. Thus, we opted for the derivation of the thermodynamic stability in order to identify the most spontaneous reactions following the sequential pathways (I-III). Assuming this approach implies that reactions take place under thermodynamical equilibrium. The former could be in contradiction with the observational data that indicate uncertainties in the estimation of physical conditions of astrophysical environments (see, e.g.; Brieva et al. 2016), but our models can still be used as a rough prediction. Thus, we chose the difference in Gibb’s free energy of formation per PAH unit (ΔGf), defined by
![Mathematical equation: $\[\Delta \mathrm{G}_{\mathrm{f}}=\frac{\sum \mathrm{G}_{\text {products }}-\sum \mathrm{G}_{\text {reactants }}}{\mathrm{n}},\]$](/articles/aa/full_html/2025/12/aa54031-25/aa54031-25-eq36.png) (5)
(5)
where Gproducts and Greactants are the Gibb’s free energy of products and reactants, respectively, which have to be summed according to the reaction pathways I-III mentioned above. The variable n indicates the number of PAH molecules attached to the C60 cage and is used to normalize the energy with respect to the PAH units. A negative and positive value of ΔGf indicates a spontaneous and non-spontaneous process, respectively. It is important to clarify that ΔGf is a thermodynamic quantity that describes the probability of reactants becoming products; however, there is no information on the ability of activation energy to cause these reactions. In this sense, even though ΔGf provides insight into the binding energy of the PAH on C60, it cannot be used as a threshold for any reaction mechanism (e.g.; dissociation, photodissociation, etc.). Theoretical studies on the C60-anthracene+ adduct suggest that the energy barriers in PAH binding to C60 can be as small as 0.08 eV, which implies that the activation energy is almost equal to the binding energy (see Figure 6 in Zhen et al. 2019b). In principle, this could be used to infer the range in activation energies of our PAH-C60 adducts, because they also follow a Diels-Alder binding. However, it is likely that differences in the thermodynamics could appear due to the fact that our models are neutral systems. Table 2 summarizes the thermodynamic data for all PAH-C60 adducts under study; all values were computed assuming a temperature of 300 K and were adequately corrected by the zero-point energy.
According to the values in Table 2, tetracene (Tn) exhibited the most spontaneous (exergonic) reactions for any of the reaction pathways assumed. Increasing the number of Tn addends made the reactions less exergonic. Such trend in ΔGf was seen for almost all PAHs, with the exception of some C60 adducts with In and Iyl. This generally indicated that the inclusion of more PAH units to C60 was energetically hindered by the geometrical arrangement of multiple PAHs to the carbon cage, which is known as the steric effect. In contrast, the thermodynamics of the Iyl adducts was the most complex one since there was no clear relationship between the ΔGf values and the reaction pathways and/or regioisomer (Table 2). However, it was clear that the single-bonded Iyl-C60 adduct models were more exergonic than the double-bonded ones (see all adduct models from 1IylC60* in Table 2). Indenyl is a planar and highly unsaturated radical that tends to change from Csp2 to Csp3 when it binds to C60. A similar behavior is known to occur for other aromatic addends (e.g.; Mas-Torrent et al. 2002).
Our predictions also showed that the formation of full hexagon PAH-C60 adducts with anthracene (An) was an exothermic process (see Eb in Table 2); similar theoretical results have been reported for C60-anthracene+ derivatives in recent studies (Zhen et al. 2019a; Wu et al. 2024). Steric and electrostatic effects should be the main factors for the thermodynamic changes when the amount of PAH addends increases, but our models contain both symmetric and asymmetric PAHs, and the thermodynamics information was thus not straightforward to interpret. Seemingly, there was no correlation between the increment in the size of fused-hexagon PAHs (An < Tn < Pn) and the observed thermodynamics (see Table 2). Future intensive efforts would be necessary to include several factors in the mechanistic description of these chemical reaction pathways.
Thermodynamic values of all PAH-C60 adducts.
4.2 Kinetics of PAH-C60 adducts
Although in the present study no precise reactivity models have been developed to predict the kinetics of our PAH-C60 adducts, previous experimental works determined these parameters for some of the adducts presented here. This section covers the state-of-the-art experimental kinetics, concerning the rate constants of the mono- and bis-adducts of C60 with anthracene, tetracene, and indene.
Kinetics analyses of PAH-C60 adduct formation have mainly been carried out during Diels-Alder synthesis, which is the common experimental method to obtain them. Sarova & BerberanSantos (2004) studied the chemical kinetics of C60 mono-adducts from anthracene and tetracene, combining experimental measurements and theoretical predictions. Using a fitting procedure, they determined rate constants following a second-order kinetics with values of 1.6×10⁻⁴M−1s−1 and 3.1×10⁻² M−1 s−1 for anthracene and tetracene, respectively, at T~298 K (Sarova & Berberan-Santos 2004). Such values indicate that the tetracene mono-adduct kinetics is much faster than for anthracene by a factor of at least 200. As we see in the next section, these kinetics data can be used, at least when the small PAHs such as anthracene and tetracene are equally abundant, for the construction of more reliable theoretical IR spectra representative of PAH-C60 adducts.
More recently, the kinetics of solid indene-C60 mono- and bis-adducts’ decomposition were reported by Rodrigues et al. (2023). The most remarkable result of the previous study is the relative rate constants between the mono- and bis-adducts; this is one of the few scarce data points of this type reported in the literature. Accordingly, a first-order kinetics defines the decomposition of mono-adducts carrying out a slower process with respect to bis-adducts (by a factor of at least 2). Arguably, solid-state kinetics can differ from the gas-phase since different forces may rule out the reaction. We are thus aware that the kinetics data by Rodrigues et al. (2023) could be far from the chemical processes occurring in astrophysical environments. However, they can be still used to build more reliable and chemical intuitive preliminary models, describing the IR emission of these PAH-C60 adducts; we elaborate on this below.
5 Astrophysical relevance
A comparison between our theoretical spectra of PAH-C60 adducts and the observational ones is not straightforward because it is well known that the relative abundances of the several species may play a key role in the landscape of the IR spectra (see, e.g.; Barzaga et al. 2023a,b). Also, all previous IR spectroscopic observations of fullerene-rich astrophysical environments were carried out by the Spitzer Space Telescope, which did not cover the ~3–5 μm region. As we will see through the current section, this is a key spectral region where the PAH-C60 adducts strongly contribute to the IR emission.
The main possible drawback of the kinetics information in the previous section could be that the rate constants are obtained from experimental reactions where anthracene and tetracene always exceeded C60. The abundances of such small PAHs and C60 in astrophysical environments are not precisely known; mainly because their more specific UV/visible electronic transitions have not been detected yet and only upper-limit estimates of their abundances10 are available (see Rouillé et al. 2021, for a recent review about C60). Another difficulty is that present abundance estimates do not come from the same astrophysical source (e.g.; the diffuse ISM, PNe, RCBs, etc.) and/or astronomical spectra. By searching in the literature, we found diffuse ISM abundance-limit estimates of both anthracene and C60 toward the same sources (the reddened stars HD 169454 and HD 183143) and using the same astronomical spectra (Gredel et al. 2011; Rouillé et al. 2021). The upper limits for column densities of interstellar C60 and anthracene are in the ranges of ~1–8 × 1012 cm−2 and 1–3 × 1012 cm−2, respectively. Other small PAHs like pyrene and 2,3-benzofluorene studied by Gredel et al. (2011) display upper limits for column densities on the same order (~2–8 × 1012 cm−2). The upper limits for C60 column densities in the ISM are very similar to those estimated toward the C60-rich circumstellar environments around PNe and RCB stars (~1–4 × 1012 cm−2, García-Hernández et al. 2012a; García-Hernández & Díaz-Luis 2013a; Díaz-Luis et al. 2015). In short, with the UV/visible astronomical data at hand, it is not possible to know the relative abundances of C60 and small PAHs in astrophysical environments such as the diffuse ISM and C60-rich circumstellar envelopes. However, recent radioastronomy observations have detected indene (In) toward the cold dark cloud TMC-1 (e.g.; Cernicharo et al. 2021), with a surprisingly high column density of ~1.6 × 1013 cm−2 (a slightly lower value of ~0.96 × 1013 cm-2 was obtained by Burkhardt et al. 2021). Although it is not known if TMC-1 harbors both C60 and indene, such observations suggest that some small PAHs can be found in very high abundance (even higher than C60) in space, as long as they are shielded from strong (inter)stellar UV photons (e.g.; Stockett et al. 2025). We note that such a possible UV shielding, permitting small PAHs to survive, may not be the case for all interstellar and circumstellar environments where fullerenes (C60, C60 + and C70) have been detected. However, these shielding conditions (e.g.; UVshielding by circumstellar dust grains) are usually met in evolved stars (sources between AGB stars and PNe) and neutral molecules, both simple (H2, CO) and complex (PAHs, C60) ones, may be formed in the outer parts or within clumps (see, e.g.; Manchado et al. 2015; Wesson et al. 2024; Gold et al. 2024; Clark et al. 2025); indeed, neutral C60 seems to be distributed in rings and/or clumps in young PNe (Díaz-Luis et al. 2018; Cami et al. 2018). In addition, for the particular case of the circumstellar environments of evolved stars, there is a rapidly changing UV radiation field (from no or very few UV photons in the AGB phase to ionizing UV photons in the PNe phase). At present, it is not known at which exact AGB-PNe evolutionary stage PAHs and fullerenes are formed. It is only known that fullerenes are detected for a very short time when the UV photons from the central star are strong enough to photoionize H (central stars with Teff~30–40 kK), but the excitation mechanism (e.g.; fluorescence vs. thermal) of the C60 IR emission is unknown (e.g.; Brieva et al. 2016). In other words, fullerenes could be formed at shielding conditions (and thus coexist with small PAHs for a certain time), but they could only be detected when excited by relatively strong UV photons and emit in the mid-IR; however, this is not always the case, and C60 emission is also detected in astrophysical environments with rather little UV radiation, as proto-PNe and RCB stars. Therefore, we tentatively estimate the possible order of magnitude of the expected abundances of PAH-C60 adducts by using the thermodynamics11 and kinetics data presented in the previous sections (see Appendix D for more details). We note that our abundance estimation assumes the average thermal conditions of the C60-rich circumstellar envelopes around evolved stars (T~300 K) but uses the estimated column densities of indene toward TMC-1 (as obtained from extremely sensitive radio observations; Burkhardt et al. 2021; Cernicharo et al. 2021). This means that our abundance estimates may be useful as rough illustrations only, because the physical conditions in the dense molecular cloud TMC-1 can be very different to those in C60-rich circumstellar environments. This is due to the lack of indene abundance estimates toward fullerene-rich circumstellar environments; for example, similar extremely sensitive radio astronomical observations toward C60-rich environments are not available in the literature. The DFT-simulated mixture spectra in Figure 6 were constructed following a procedure similar to that in Barzaga et al. (2023a,b); we invite the reader to consult Appendix D12 for more details.
From Figure 6, the important effect of considering the PAH-C60 abundances in the resulting IR spectra was very clear. The pure summed PAH-C60 mixture in Figure 6a exhibited a spectrum, mainly characterized by strong emission features at ~3.4–3.6, 14.2, 14.7, and 15.1 μm. These features were characteristic of the Iyl bis-adduct under configuration g (Figure B.1g), which is highly unstable. This landscape drastically changed when our estimated PAH-C60 abundances were considered in the simulations. In particular, there was a strong modification in the 3.4–3.6 μm feature, which became split in the abundance-weighted PAH-C60 mixtures, with distinctive peaks at 3.43, 3.51, and 3.57 μm (see Figures 6b and c and Appendix F). Furthermore, the abundance-weighted spectra were spectrally richer along the full ~5–20 μm spectral range in terms of distinguishable peaks, showing numerous features that were weaker than the 3.4–3.6 μm one, but still noticeable. The most intense IR features in the latter spectral range were those at ~6.7–7.4, 12.2–14.0, and 18.6–19.2 μm. In short, the strong differences seen in the DFT spectra in Figure 6 highlight the importance of at least considering the tentative abundances of the several species in the theoretical simulation of IR spectra from PAH-C60 adducts.
Interestingly, there was a common factor in the spectra of Figure 6, which was the general absence of IR contribution at the wavelengths of the astronomical PAHs (at ~6.2, 7.7, 8.6, 11.2, and 12.7 μm) and the C60 features at ~8.5 and 17.4 μm. Although both species were the progenitors of PAH-C60 adducts, the resulting theoretical spectra with (by far) the most intense IR bands at ~3.4–3.6 μm did not indicate their presence. From an astronomical point of view, this suggested that PAH-C60 adducts could contribute to the ~3.4–3.6 μm IR emission and are usually attributed to aliphatic carbon species (see below). The astronomical PAH and C60 features are well characterized, and the astrophysical community has generally accepted that their detection indicates the presence of these species. However, according to our tentative predictions, the absence of IR emission from PAHs and/or C60 does not necessarily mean that they are not present; they could be present, instead forming more complex hybrid species such as PAH-C60 adducts. A recent theoretical work by Xu et al. (2023) found that much simpler C60 adducts, such as C60H+ and C60O+, exhibit most of the pristine C60 features in their predicted IR spectra. Apparently, such a difference is due to the large diversity in the interactions between the PAHs and C60. Thus, the predictions presented here suggest that one of the possible explanations for the lack of PAH and C60 features in astronomical environments could be the formation of their adducts.
Our theoretical calculations may also give some insights into the possible origin of the ~3.4–3.6 μm IR features, sometimes observed in astronomical sources (see, e.g.; Li 2020, for a recent review), for example in proto-PNe; there, satellite features from 3.4 to 3.6 μm accompanying the 3.3 μm feature have been observed (Geballe et al. 1992; Hrivnak et al. 2007; Materese et al. 2017). Such 3–5 μm observations, however, have been carried out with space- and ground-based telescopes less sensitive than Spitzer, which otherwise did not cover this spectral range. In particular, Geballe et al. (1992) analyzed several objects in the short transition phase from AGB stars to PNe (i.e., proto-PNe) and observed remarkably strong 3.4–3.5 μm emission relative to the usually dominant 3.3 μm feature. They concluded that the observed 3.4–3.5 μm features cannot be explained by the presence of stretch overtones of CH produced by PAHs, and they suggested that they should be assigned to the stretching modes of aliphatic CH2 and CH3 groups. On the other hand, Materese et al. (2017) suggested that the correlation between the abnormally intense 3.4–3.5 μm and 6.9 μm features observed in this kind of post-AGB object could be due to the presence of superhydrogenated PAHs (Hn-PAHs) containing aliphatic CH2 and CH3 moieties. The carbon chemistry in space is dominated by the 3.3 and 3.4 μm features or aromatic-aliphatic dichotomy, with aromatics (PAHs; 3.3 μm) generally believed to be a main component of carbon in space. This popular perception, however, could be challenged in the JWST era. Thanks to the exceptional sensitivity and spectral resolution of recent JWST observations, the 3.4 μm features are routinely detected in very different types of astronomical sources, many of them with a no significant UV radiation field such as proto-PNe, trojans, active galactic nuclei (see, e.g., Lai et al. 2023; Wong et al. 2024), and in more evolved and old PNe with a much stronger UV-radiation field (Clark et al. 2025).
Considerable efforts have been made in the past to understand the origin (aliphatics, PAHs, etc.) of these unusual ~3.4–3.6 μm features. The PAH molecules can barely fit these features by using a very large family of irregular structures, even assuming the effects of anharmonic couplings due to high temperatures (see, e.g.; Joblin et al. 1995; Candian et al. 2012; Bauschlicher et al. 2009). A more recent theoretical work suggests that IR features beyond 3.4 μm, which is the archetypal aliphatic CH stretching mode, cannot be assigned to pure CH bonds (Sadjadi et al. 2017). According to Sadjadi et al. (2017), those features should probably involve another element (e.g.; N, S, O) besides C and H, contaminating the CH stretching. On the other hand, hydrogenated fullerenes (fulleranes) have also been suggested to contribute in the ~3.4–3.6 μm region via their CH bonds (Iglesias-Groth et al. 2012; Zhang et al. 2017). This is reinforced by recent abundance predictions, suggesting that C60H+ should be abundant in the diffuse ISM (Abbink et al. 2024). Also, accurate experimental studies on fulleranes (C60H+, C70H+; Palotás et al. 2020; Finazzi et al. 2024) and oxidized fullerenes (C60O+, C60OH+; Palotás et al. 2022) demonstrate that these species have a common IR emission region around ~6.2–8.3 μm, corresponding to CC vibrations. Thus, since all these fullerene compounds contain CH and CC stretching, their IR spectra could be entangled with those from PAH-C60 adducts in several spectral regions. However, a possible way to tackle this, in order to resolve or distinguish their contribution in astronomical IR spectra, is via the CH/CC stretching-band ratio. For example, Finazzi et al. (2024) find that the CH/CC band ratio for fulleranes is quite small due to their low IR intensity of CH stretching; we note that CH stretching is not present for oxidized fullerenes (Palotás et al. 2022). In contrast, the PAH-C60 adducts studied here display a CH/CC band ratio larger than that of fulleranes (see Figure 3). The potential use of the CH/CC band ratio to distinguish between different H-containing fullerene derivatives would require sensitive astronomical data such as those from the JWST; i.e., covering the entire IR range (~3–25 μm) of molecular vibrations.
Clearly, there is no consensus yet about the carrier/s of the ~3.4–3.6 μm features (and similarly occurs for the 6.9 μm feature generally observed in conjunction with them). Our experimental-theoretical study of PAH-C60 adducts suggests other species that may contribute at these wavelengths (see Figures 3, 6, and F.4). Remarkably, the PAH-C60 adducts display strong ~3.4–3.6 μm features without the presence of aliphatic CH bonds (with the exception of the indene derivatives) due to the interplay between C60 and small PAHs (see figures in Appendix F). In contrast to Sadjadi et al. (2017) and Zhang et al. (2017), which used a diverse set of model structures, our set of PAH-C60 adducts are rather structurally simple. It is thus likely that the contamination of PAH-C60 adducts by aliphatic chains within the PAH structure would increase the intensity of the ~3.4–3.6 μm IR features even more. Future efforts should enlarge the PAHs’ diversity, from linear-to-branched or even helical structures.
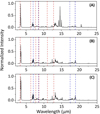 |
Fig. 6 DFT-simulated IR (~3–25 μm) spectra of the mixture of PAH-C60 adducts. (A) Total (summed) mixture spectrum; (B): total abundance-weighted spectrum using the indene abundance from Burkhardt et al. (2021); and (C) total abundance-weighted spectrum using the indene abundance from Cernicharo et al. (2021). In all panels, the dashed red lines mark the most common astronomical PAH features (at ~3.3, 6.2, 7.7, 8.6, 11.2, and 12.7 μm), instead dashed blue lines mark the four strongest C60 features (~7.0, 8.5, 17.4, and 18.9 μm. In the case of the total (summed) mixture spectrum, the intensity has been normalized to the maximum intensity peak, while the abundance-weighted spectra have been normalized with respect to the higher intensity peak from the weighted spectrum (C); i.e., the one using the indene abundance from Cernicharo et al. (2021). |
6 Summary
In summary, we computed IR simulated spectra of multiple PAH-C60 adducts based on experimental data combined with quantum-chemical calculations. According to the experimental data and theoretical results, the formation of these new species would almost erase the presence of most of the characteristic IR features from the pristine PAHs and some from isolated C60. Furthermore, we have very roughly estimated the possible abundances of PAH-C60 adducts in C60-rich astrophysical environments by applying the state-of-the-art kinetics data, hopefully building more reliable and global (or weighted) simulated IR spectra. Consequently, the abundance-weighted spectra displayed a series of new relevant IR features like a broad ~3.4–3.6 μm feature, a richer 6–10 μm spectral region, a strong modification within the 12–16 μm range, together with emission contribution to the 7.0 and 18.9 μm C60 features. Surprisingly, the PAH-C60 adducts presented here, with almost no CH aliphatic in their structure, displayed strong ~3.4–3.6 μm features and could be potential carriers of this kind of emission in astronomical environments; this is especially the case in those where C60 is known to be abundant. Unfortunately, previous IR observations of C60-rich astrophysical environments were done by Spitzer with no access to the 3–5 μm spectral range. However, such observations could be made at high sensitivity by the JWST; its spectral coverage is well below 5 μm. This along with high-quality experimental IR spectra of diverse PAH-C60 adducts (e.g.; including those formed by C60 and PAHs of different sizes and chemical natures) will give more insights into the possible IR emission contribution of PAH-C60 adducts to the 3–4 μm spectral region.
Data availability
All the scaled harmonic DFT spectra presented herein, as well as the IR cross sections used to construct them, are available at https://doi.org/10.5281/zenodo.17485506.
Acknowledgements
We acknowledge the support from the State Research Agency (AEI) of the Ministry of Science, Innovation and Universities (MICIU) of the Government of Spain, and the European Regional Development Fund (ERDF), under grants PID2020-115758GB-I00/AEI/10.13039/501100011033, PID2022-136970NB-I00/AEI/10.13039/501100011033 and PID2023-147325NB-I00/AEI/10.13039/501100011033. The authors also express their gratitude to the Deanship of Graduate Studies and Scientific Research at Taif University for their financial support of this work. This publication is based upon work from COST Action CA21126 – Carbon molecular nanostructures in space (NanoSpace), supported by COST (European Cooperation in Science and Technology). R.B. and B.K. also acknowledge the generous allocation of computer time at LaPalma-IAC Supercomputer and CITIC Universidade da Coruña. This article used flash storage and CPU/GPU computing resources as Indefeasible Computer Rights (ICRs) being commissioned at the ASTRO POC project that Light Bridges will operate in the Island of Tenerife, Canary Islands (Spain). The ICRs used for this research were provided by Light Bridges in cooperation with Hewlett Packard Enterprise (HPE) and VAST DATA. The authors wish to acknowledge the contribution of the IAC High-Performance Computing support team and hardware facilities to the results of this research. BK is grateful to Science by Women program for funding a six-months visiting senior research fellowship to IAC. The authors acknowledge Deanship of Scientific Research, Taif University for funding this work.
References
- Abbink, D., Foing, Bernard, & Ehrenfreund, Pascale. 2024, A&A, 684, A165 [NASA ADS] [CrossRef] [EDP Sciences] [Google Scholar]
- Allamandola, L., Tielens, A., & Barker, J. 1989, ApJS, 71, 733 [NASA ADS] [CrossRef] [Google Scholar]
- Arun, R., Mathew, B., Manoj, P., et al. 2023, MNRAS, 523, 1601 [NASA ADS] [CrossRef] [Google Scholar]
- Avery, L. W., MacLeod, J. M., & Broten, N. W. 1982, ApJ, 254, 116 [Google Scholar]
- Barham, J. P., Tanaka, S., Koyama, E., et al. 2018, J. Org. Chem., 83, 4348 [Google Scholar]
- Barzaga, R., García-Hernández, D. A., Díaz-Tendero, S., et al. 2023a, ApJ, 942, 5 [Google Scholar]
- Barzaga, R., García-Hernández, D. A., Díaz-Tendero, S., et al. 2023b, ApJS, 269, 26 [Google Scholar]
- Bauschlicher, Jr., C. W., Peeters, E., & Allamandola, L. J. 2009, ApJ, 697, 311 [NASA ADS] [CrossRef] [Google Scholar]
- Bauschlicher, Charles W., J., Ricca, A., Boersma, C., & Allamandola, L. J. 2018, ApJS, 234, 32 [NASA ADS] [CrossRef] [Google Scholar]
- Beheshtian, J., Peyghan, A. A., & Bagheri, Z. 2012, ApSS, 258, 8980 [Google Scholar]
- Berné, O., Cox, N. L. J., Mulas, G., & Joblin, C. 2017, A&A, 605, L1 [NASA ADS] [CrossRef] [EDP Sciences] [Google Scholar]
- Boersma, C., Bauschlicher, C. W., Ricca, A., et al. 2014, ApJS, 211, 8 [NASA ADS] [CrossRef] [Google Scholar]
- Brieva, A. C., Gredel, R., Jäger, C., Huisken, F., & Henning, T. 2016, ApJ, 826, 122 [NASA ADS] [CrossRef] [Google Scholar]
- Burkhardt, A. M., Lee, K. L. K., Changala, P. B., et al. 2021, ApJ, 913, L18 [Google Scholar]
- Cami, J., Bernard-Salas, J., Peeters, E., & Malek, S. E. 2010, Science, 329, 1180 [NASA ADS] [CrossRef] [Google Scholar]
- Cami, J., Bernard-Salas, J., Peeters, E., & Malek, S. E. 2011, Proc. IAU, 7, 216 [Google Scholar]
- Cami, J., Peeters, E., Bernard-Salas, J., Doppmann, G., & De Buizer, J. 2018, Galaxies, 6, 101 [NASA ADS] [CrossRef] [Google Scholar]
- Campbell, E., Holz, M., Gerlich, D., & Maier, J. 2015, Nature, 523, 322 [NASA ADS] [CrossRef] [Google Scholar]
- Candian, A., Kerr, T. H., Song, I.-O., McCombie, J., & Sarre, P. J. 2012, MNRAS, 426, 389 [NASA ADS] [CrossRef] [Google Scholar]
- Cataldo, F., García-Hernández, D. A., & Manchado, A. 2014, FNCN, 22, 565 [Google Scholar]
- Cernicharo, J., Agúndez, M., Cabezas, C., et al. 2021, A&A, 649, L15 [EDP Sciences] [Google Scholar]
- Cernicharo, J., Cabezas, C., Fuentetaja, R., et al. 2024, A&A, 690, L13 [NASA ADS] [CrossRef] [EDP Sciences] [Google Scholar]
- Chown, R., Sidhu, Ameek, Peeters, Els, et al. 2024, A&A, 685, A75 [NASA ADS] [CrossRef] [EDP Sciences] [Google Scholar]
- Clark, N., Peeters, E., Cox, N. L. J., et al. 2025, MNRAS, 540, 1984 [Google Scholar]
- Díaz-Luis, J. J., García-Hernández, D. A., Kameswara Rao, N., Manchado, A., & Cataldo, F. 2015, A&A, 573, A97 [NASA ADS] [CrossRef] [EDP Sciences] [Google Scholar]
- Díaz-Luis, J. J., García-Hernández, D. A., Manchado, A., et al. 2018, AJ, 155, 105 [Google Scholar]
- Dunk, P. W., Adjizian, J.-J., Kaiser, N. K., et al. 2013, PNAS, 110, 18081 [Google Scholar]
- Dunn, J. L., & Rashed, E. 2018, J. Phys. Conf. Ser., 1148, 012003 [Google Scholar]
- Ehrlich, S., Moellmann, J., & Grimme, S. 2013, AcChR, 46, 916 [Google Scholar]
- El Bakouri, O., Garcia-Borràs, M., Girón, R. M., et al. 2018, PCCP, 20, 11577 [Google Scholar]
- Finazzi, L., Esposito, V. J., Palotás, J., et al. 2024, ApJ, 971, 168 [Google Scholar]
- Frisch, M. J., Trucks, G. W., Schlegel, H. B., et al. 2016, Gaussian 16 Revision C.01, Gaussian Inc. Wallingford CT [Google Scholar]
- Fu, W., & Hopkins, W. S. 2018, JPCA, 122, 167 [Google Scholar]
- García-Hernández, D. A., Manchado, A., García-Lario, P., et al. 2010, ApJ, 724, L39 [CrossRef] [Google Scholar]
- García-Hernández, D. A., Kameswara Rao, N., & Lambert, D. L. 2011a, ApJ, 729, 126 [CrossRef] [Google Scholar]
- García-Hernández, D. A., Iglesias-Groth, S., Acosta-Pulido, J. A., et al. 2011b, ApJ, 737, L30 [Google Scholar]
- García-Hernández, D. A., Kameswara Rao, N., & Lambert, D. L. 2012a, ApJ, 759, L21 [Google Scholar]
- García-Hernández, D. A., Villaver, E., García-Lario, P., et al. 2012b, ApJ, 760, 107 [Google Scholar]
- García-Hernández, D. A., & Díaz-Luis, J. J. 2013a, A&A, 550, L6 [NASA ADS] [CrossRef] [EDP Sciences] [Google Scholar]
- García-Hernández, D. A., Cataldo, F., & Manchado, A. 2013b, MNRAS, 434, 415 [Google Scholar]
- Geballe, T., Tielens, A., Kwok, S., & Hrivnak, B. 1992, ApJ, 387, L89 [Google Scholar]
- Gerlich, D., Jašík, J., Strelnikov, D. V., & Roithová, J. 2018, ApJ, 864, 62 [Google Scholar]
- Gold, K. R., Schmidt, D. R., & Ziurys, L. M. 2024, ApJ, 976, 196 [Google Scholar]
- Gredel, R., Carpentier, Y., Rouillé, G., et al. 2011, A&A, 530, A26 [CrossRef] [EDP Sciences] [Google Scholar]
- Grimme, S., Antony, J., Ehrlich, S., & Krieg, H. 2010, JChPh, 132, 154104 [Google Scholar]
- He, Y., Chen, H.-Y., Hou, J., & Li, Y. 2010, J. Am. Chem. Soc., 132, 1377 [CrossRef] [PubMed] [Google Scholar]
- Hirsch, A. 1995, Synthesis, 1995, 895 [Google Scholar]
- Hrivnak, B. J., Geballe, T. R., & Kwok, S. 2007, ApJ, 662, 1059 [Google Scholar]
- Iglesias-Groth, S. 2019, MNRAS, 489, 1509 [NASA ADS] [Google Scholar]
- Iglesias-Groth, S., García-Hernández, D. A., Cataldo, F., & Manchado, A. 2012, MNRAS, 423, 2868 [Google Scholar]
- Jin, H., Xing, L., Hao, J., et al. 2019, CoFl, 206, 1 [Google Scholar]
- Joblin, C., Boissel, P., Leger, A., d’Hendecourt, L., & Defourneau, D. 1995, A&A, 299, 835 [Google Scholar]
- Katsyuba, S. A., Zvereva, E. E., & Burganov, T. I. 2013, JPCA, 117, 6664 [Google Scholar]
- Kempkes, L. J. M., Martens, J., Berden, G., Houthuijs, K. J., & Oomens, J. 2019, FaDi, 217, 434 [Google Scholar]
- Khodam Hazrati, M., & L. Hadipour, N. 2016, Comput. Theor. Chem., 1098, 63 [Google Scholar]
- Krusic, P. J., Wasserman, E., Keizer, P. N., Morton, J. R., & Preston, K. F. 1991, Science, 254, 1183 [Google Scholar]
- Lai, T. S.-Y., Armus, L., Bianchin, M., et al. 2023, ApJ, 957, L26 [NASA ADS] [CrossRef] [Google Scholar]
- Li, A. 2020, NatAs, 4, 339 [NASA ADS] [Google Scholar]
- Li, F.-B. 2022, in Handbook of Fullerene Science and Technology (Berlin: Springer), 273 [Google Scholar]
- Lifshitz, A., Tamburu, C., Suslensky, A., & Dubnikova, F. 2004, JPCA, 108, 3430 [Google Scholar]
- Manchado, A., Stanghellini, L., Villaver, E., et al. 2015, ApJ, 808, 115 [NASA ADS] [CrossRef] [Google Scholar]
- Mas-Torrent, M., Rodríguez-Mias, R. A., Solà, M., et al. 2002, J. Org. Chem., 67, 566 [Google Scholar]
- Materese, C. K., Bregman, J. D., & Sandford, S. A. 2017, ApJ, 850, 165 [NASA ADS] [CrossRef] [Google Scholar]
- Mattioda, A. L., Hudgins, D. M., Boersma, C., et al. 2020, ApJS, 251, 22 [NASA ADS] [CrossRef] [Google Scholar]
- McGuire, B. A., Loomis, R. A., Burkhardt, A. M., et al. 2021, Science, 371, 1265 [Google Scholar]
- Mulholland, J. A., Lu, M., & Kim, D.-H. 2000, PComI, 28, 2593 [Google Scholar]
- Müller, F., Stückrath, J. B., Bischoff, F. A., et al. 2020, J. Am. Chem. Soc., 142, 18050 [Google Scholar]
- Otsuka, M., Kemper, F., Hyung, S., et al. 2013, ApJ, 764, 77 [Google Scholar]
- Palotás, J., Martens, J., Berden, G., & Oomens, J. 2020, NatAs, 4, 240 [Google Scholar]
- Palotás, J., Martens, J., Berden, G., & Oomens, J. 2022, JPCA, 126, 2928 [Google Scholar]
- Peeters, E., Mackie, C., Candian, A., & Tielens, A. G. G. M. 2021, AcChR, 54, 1921 [Google Scholar]
- Peeters, E., Habart, E., Berné, O., et al. 2024, A&A, 685, A74 [NASA ADS] [CrossRef] [EDP Sciences] [Google Scholar]
- Petersson, G. A., & Al-Laham, M. A. 1991, JChPh, 94, 6081 [Google Scholar]
- Petersson, G. A., Bennett, A., Tensfeldt, T. G., et al. 1988, JChPh, 89, 2193 [Google Scholar]
- Polfer, N. C. 2011, CSRev, 40, 2211 [Google Scholar]
- Pousse, E., Tian, Z., Glaude, P., Fournet, R., & Battin-Leclerc, F. 2010, CoFl, 157, 1236 [Google Scholar]
- Puget, J. L., & Léger, A. 1989, A&A, 27, 161 [Google Scholar]
- Pujals, M., Pèlachs, T., Fuertes-Espinosa, C., et al. 2022, CRPS, 3, 100992 [Google Scholar]
- Roberts, K. R. G., Smith, K. T., & Sarre, P. J. 2012, MNRAS, 421, 3277 [CrossRef] [Google Scholar]
- Rodrigues, D. J. L., Santos, L. M. N. B. F., Melo, A., & Lima, C. F. R. A. C. 2022, Organics, 3, 364 [Google Scholar]
- Rodrigues, D. J., Pina, I. B., Santos, L. M., & Lima, C. F. 2023, DRM, 136, 110031 [Google Scholar]
- Roithová, J., Gray, A., Andris, E., Jašík, J., & Gerlich, D. 2016, AcChR, 49, 223 [Google Scholar]
- Rosenberg, M. J. F., Berné, O., & Boersma, C. 2014, A&A, 566, L4 [NASA ADS] [CrossRef] [EDP Sciences] [Google Scholar]
- Rouillé, G., Krasnokutski, S. A., & Carpentier, Y. 2021, A&A, 656, A100 [NASA ADS] [CrossRef] [EDP Sciences] [Google Scholar]
- Sabirov, D. S., Terentyev, A. O., & Cataldo, F. 2016, Comput. Theor. Chem., 1081, 44 [Google Scholar]
- Sadjadi, S., Zhang, Y., & Kwok, S. 2017, ApJ, 845, 123 [NASA ADS] [CrossRef] [Google Scholar]
- Sarova, G. H., & Berberan-Santos, M. N. 2004, CPL, 397, 402 [Google Scholar]
- Sellgren, K., Werner, M. W., Ingalls, J. G., et al. 2010, ApJ, 722, L54 [NASA ADS] [CrossRef] [Google Scholar]
- Stephens, P. J., Devlin, F. J., Chabalowski, C. F., & Frisch, M. J. 1994, JPhCh, 98, 11623 [Google Scholar]
- Stockett, M. H., Subramani, A., Liu, C., et al. 2025, J. Chem. Phys., 162, 184306 [Google Scholar]
- Wenzel, G., Gong, S., Xue, C., et al. 2025a, ApJ, 984, L36 [Google Scholar]
- Wenzel, G., Speak, T. H., Changala, P. B., et al. 2025b, Nat. Astron., 9, 262 [Google Scholar]
- Wesson, R., Matsuura, M., Zijlstra, A. A., et al. 2024, MNRAS, 528, 3392 [NASA ADS] [CrossRef] [Google Scholar]
- Wong, I., Brown, M. E., Emery, J. P., et al. 2024, PSJ, 5, 87 [Google Scholar]
- Wu, Y., Hu, X., Zhen, J., & Yang, X. 2024, MNRAS, 531, 682 [Google Scholar]
- Xu, J., Li, A., Li, X., & Hou, G.-L. 2023, MNRAS, 525, 3061 [Google Scholar]
- Zapata Trujillo, J. C., & McKemmish, L. K. 2022a, WIREs Comput. Mol. Sci., 12, e1584 [Google Scholar]
- Zapata Trujillo, J. C., & McKemmish, L. K. 2022b, JPCA, 126, 4100 [Google Scholar]
- Zapata Trujillo, J. C., & McKemmish, L. K. 2023, JPCA, 127, 1715 [Google Scholar]
- Zhang, Y., & Kwok, S. 2015, ApJ, 798, 37 [Google Scholar]
- Zhang, Y., Sadjadi, S., Hsia, C.-H., & Kwok, S. 2017, ApJ, 845, 76 [CrossRef] [Google Scholar]
- Zhen, J., Zhang, W., Yang, Y., & Zhu, Q. 2019a, MNRAS, 490, 3498 [Google Scholar]
- Zhen, J., Zhang, W., Yang, Y., Zhu, Q., & Tielens, A. G. G. M. 2019b, ApJ, 887, 70 [Google Scholar]
Note that the PAH model proves to reproduce the UIR emission bands, but it is not the only explanation; e.g.; a family of PAH model spectra can also, in some sources, fit the spectra of several other species, both organic and inorganic ones (see, e.g.; Zhang & Kwok 2015).
Very recently, cyano derivatives of the PAHs acenaphthylene (C12H8), pyrene (C16H10), and coronene (C24H12) have been radioastronomically detected in TMC-1; they are the largest PAH derivatives presently detected in space (Cernicharo et al. 2024; Wenzel et al. 2025b,a).
The definition of C60 adducts implies the binding of another organic molecule and/or functional group; e.g.; alkyl chains, alcohols, and others.
Regioisomers are molecules with the same chemical composition and functionality, but with different spatial arrangement.
For the particular case of indene, we only obtained the adduct formed by 2H-indene and C60. According to our calculations, the 1H-indene, which is the most stable isomer, transforms into 2H-indene upon bonding to the C60 cage.
The Max.r.e is defined as the maximum value from the relative error of the new scaling factors with respect to the AMES PAH database ones. The Max.r.e. is calculated using the scaled harmonic frequencies for each method according to the equation Max.r.e ![Mathematical equation: $\[<\frac{\mathrm{SF}_{3}^{\text {new }}-\mathrm{SF}_{3}^{\text {AMES}}}{\mathrm{SF}_{3}^{\text {AMES}}}\]$](/articles/aa/full_html/2025/12/aa54031-25/aa54031-25-eq54.png) .
.
In the case of pure hexagon PAHs such as anthracene (An), tetracene (Tn), and pentacene (Pn), the maximum different CH bonds in the mono-adducts was two; this refers to those CH close and far from the binding. In contrast, 2H-indene (In) and indenyl (Iyl) had more than four different CH bonds due to the presence of pentagons and hexagons, broadening the 3.3–3.6 μm feature. This was quite noticeable for In, which contained CH bonds connected to a Csp3, creating multiple chemically different CH stretching.
In the case of tetracene (Tn), we also considered another possible way of binding, but it was highly thermodynamically unstable and also lacked chemical principles (see Appendix E for more details).
This occurred for all the PAH-C60 adducts under study, with the only exception being Iyl, which showed a broadness reaching up to 19.2 μm due to the combination with the intrinsic PAH vibrations.
Note that the C60 abundance estimates from the IR emission usually assume thermal emission as excitation mechanism (see, e.g.; Cami et al. 2010; García-Hernández et al. 2012b, and references therein) and the IR bands attributed to C60 may actually comprise contributions by analogous species like metallofullerenes (see, e.g.; Barzaga et al. 2023a,b). In fact, Brieva et al. (2016) concluded that thermal excitation alone cannot explain the IR spectra attributed to C60 in some planetary nebulae, and also that a possible explanation is that other molecules than C60 may contribute to the observed spectra.
In this case, we have used the enthalpy energy, which is directly obtained from our quantum-chemistry calculations as well as the free Gibb’s energies listed in Table 2.
In the case of the total abundance-weighted spectra, they both have been normalized with respect to the maximum intensity peak obtained from the Cernicharo et al. (2021) indene abundance data (spectrum C in Figure 6). This way, the change in IR intensity with respect to the lower indene abundance from Burkhardt et al. (2021) is noticeable (spectrum B in Figure 6).
In the case of the model in Figure B.1g the point group was defined as C2h, which is one of the symmetry subgroups producing a Jahn-Teller distortion in C60 derivatives.
The column density is transformed to abundance (or concentration, in mol/cm3) by assuming the TMC-1 geometrical model of Avery et al. (1982) and a distance of 140 pc; i.e. basically along a path of 0.14 pc.
Appendix A Empirical-corrected scaling factors
The scaling factors reported in Table 1 were empirically corrected in the ~3.3 μm region to improve the accuracy with respect to the experimental spectra (see the corresponding Section and related discussion); Table A.1 shows the final values.
Appendix B Bis-adducts
Multiple configurations (isomers) can be generated for the bis-adducts according to the arrangement of the PAHs bonded to the C60 cage. The isomers were molecular structures defined by the same chemical formula but with different spatial distribution. The number of possible isomers (or structures) was extremely large because it depends on the degrees of freedoms for the PAHs and C60. Thus, in order to reduce the number of possible models we have used the stability and isomerization information available in the literature. Previous theoretical works have studied the stability and isomerization of anthracene bis-adducts, allowing us to discriminate between the different models and select the most stable structures (Sabirov et al. 2016; Rodrigues et al. 2022). This isomerization information was also used to built the rest of the bis-adduct models, facilitating our theoretical predictions by significantly reducing the amount of models under consideration. Figure B.1 displays the bis-adducts structures considered together with their corresponding most stable isomers. For the anthracene (An) case, only one structure is shown; i.e. the most stable configuration as demonstrated by previous and extensive theoretical studies (Sabirov et al. 2016; Rodrigues et al. 2022). Furthermore, as already mentioned in Sect. 2.3, the anthracene bis-adduct (2AnC60) has been obtained precisely using a novel experimental synthetic method (Pujals et al. 2022) and used for the validation of scaling factors.
The spectra displayed in Figures B.1a-c, which correspond to the bis-adducts of 2H-indene, did not exhibit significant differences between them; the only difference is the isomer c (Figure B.1c). Actually, it is quite difficult to distinguish the IR emission produced by these isomers of 2H-indene bis-adducts. The different configuration of the PAHs with respect to the C60 cage neither the increment of PAH units implicate a noticeable change of the IR spectra, in comparison to the mono-adduct analogous (1InC60′, see Figure 4). The most prominent change was seen for the CH stretching feature at ~3.3–3.6 μm, which increases its intensity, reflecting the increment of CH units from mono- to bis-adducts.
On the contrary, the IR spectra produced by the isomers of indenyl bis-adducts display noticeable differences between them and also when compared to their mono-adduct analogous (Figures B.1d-g and F.2); with the clear presence of distinctive IR spectral features depending on the isomer. The indenyl isomers had these specific features mainly due to the change of the PAH binding to the C60 cage. The PAH could bind C60 with one or two CC bonds depending on the structure, while for 2H-indene the binding was always the same. Models like those in Figures B.1d-e denote single CC bonds between the PAH and C60. Both exhibited subtle differences in terms of intensity, but they possessed four distinctive features: (i) a broad plateau feature from 13 to 14.7 μm; (ii) a clear discrete ~12.4 μm feature accompanied with well-defined peaks around it; (iii) a broad 6.7–7.5 μm band; and (iv) a strong ~3.3–3.5 μm feature accompanied by a satellite feature at ~3.6 μm.
A higher stability is not always an indication of more detectable features, and the complexity of the IR spectra depends more on the charge reordering and change in the dipole moment induced by the PAH-C60 bonding. The former was clearly understandable observing the spectra in Figures B.1f-g, corresponding to the less stable isomers of indenyl bis-adducts. The specific features observed in these spectra were quite noticeable in terms of intensity; for instance, Figure B.1f shows an intense narrow signal at ~14.2 μm accompanied by broader feature centered at ~13.3 μm. Under this configuration f, the IR spectrum shows a resemblance with its mono-adduct analogous (1IylC60′), maintaining almost the same features. Such behavior indicated that binding two indenyl molecules to C60 following this geometry almost did not destroy the symmetry of the vibrations. Interestingly, the model in Figure B.1g results in weakly bonded indenyl molecules, but it showed the richer IR spectrum of all of the bis-adduct models. Multiple features (e.g. at ~13.0, 14.6, 15.0 and 20.6 μm) surpassed in intensity the ~3.3–3.6 μm band, which is usually the most intense signal in the PAH-C60 adducts described so far; where most of the vibrations, implying CC stretching and CH out-of-plane, close to the PAH-C60 bond create a distortion similarly to a Jahn-Teller effect (Dunn & Rashed 2018)13. Seemingly, these CH out-of-plane vibrations were IR active in the bis-adduct due to the higher planarity and aromaticity of the indenyl structure. This combined to the configuration in Figure B.1g produced the strong features at ~14.6, 15.0 and 20.6 μm. However, the analogous bis-adduct for 2H-indene with a similar configuration (Figure B.1c) did not display such CH out-of-plane active vibrations because the presence of CH2 in 2H-indene reduces the planarity and aromaticity of the molecular structure. Nevertheless, it is likely that the indenyl bis-adduct (Figure B.1g) should be a species with a rather short-lifetime as a consequence of the weak bonds between the PAHs and C60. Finally, the IR features seen in the simulated spectra of the models for the An and Tn bis-adducts (Figures B.1h-i) were characterized only by an increment of CH stretching (3.3–3.6 μm) due to the amount of added bonds.
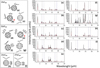 |
Fig. B.1 Left: Models of the PAH-C60 bis-adducts after geometry optimization for the PAHs 2H-indene (2InC60, a-c), indenyl (2IylC60, d-g), anthracene (2AnC60, h), and tetracene (2TnC60, i). In the case that the bis-adduct has different configurations (isomers), the most stable structure is highlighted with a red asterisk. Right: The theoretical IR spectra corresponding to the bis-adducts structures a-i presented in the left panel. In all panels, the red dashed spectra correspond to the mono-adduct analogous, while the blue dashed lines mark the four strongest C60 features (~7.0, 8.5, 17.4 and 18.9 μm). Note that the convolution parameters are the same as in Figures 4 and 5. |
Appendix C Tris-adducts
In order to build the models of the PAH-C60 tris-adducts, we have selected the corresponding bis-adduct from the previous Appendix B and added another PAH unit to the structure. Arguably, this could bias the final structures since we did not explore multiple possible isomers, but it was our preferred way to screening the number of structures; which again, would be huge due to the high number of degrees of freedom. Figure C.1 shows the models and IR spectra of the tris-adducts for In, Ilyl and An. As we have mentioned before, the C60 tris-adducts models for tetracene and pentacene were not built because of the computational limitations.
Figure C.1 shows non-significant differences in the IR spectra of the same PAH-C60 tris-adduct; except, again for the C60 tris-adducts with indenyl (3IylC60, panels c-e in Figure C.1). In particular, for configuration e where the spectral change was due to the single CC bond between the PAH and C60. Furthermore, the 3IylC60 spectra were still very similar to the ones from their mono-adducts analogous; although, the intensity varied for the most important vibrations that depend on the number of CH bonds (see also Figure 4). The forces exerted over the C60 cage by the binding of three PAH units create a highly symmetric carbon cage, which was equivalent to the mono-adducts and that was reflected in the spectra similarities. Thus, according to our theoretical predictions it should be very difficult to distinguish, in terms of pure IR emission features, mono- from tris-adducts.
In summary, the main characteristics of the C60 tris-adducts spectra were: (i) the more noticeable broad feature, centered at ~3.5 μm, for 2H-indene (Figures C.1a-b); and (ii) the presence of a weaker red-shifted feature at ~3.6 μm (Figures C.1e-g), which denoted the increment of non-equivalent CH bonds by symmetry directly connected to C60. Such features were difficult to distinguish in the case of mono- and bis-adducts due to the lower number of CH bonds implicated. Both features were related to CH bonds but implied different chemical environments; for 2H indene tris-adducts, they were a consequence of the contribution of more CH2 bonds, while for the indenyl and anthracene cases, they were related to the CH closest to the CC bonded to C60. Finally, it is worth noting that in the case of indenyl, the feature at ~3.6 μm only appeared in the model e with a CC single bond to C60 (see Figures C.1c-e and Appendix F for a comparison).
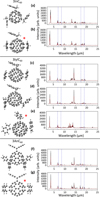 |
Fig. C.1 Left: Models of the PAH-C60 tris-adducts after geometry optimization for the PAHs 2H-indene (3InC60, a-b), indenyl (3IylC60, c-e) and anthracene (3AnC60, f-g). In the case that the tris-adduct has different configurations (isomers), the most stable structure is highlighted with a red asterisk. Right: The theoretical IR spectra corresponding to the tris-adducts structures a-g presented in the left panel. In all panels, the red dashed spectra correspond to the bis-adduct analogous, while the blue dashed lines mark the four strongest C60 features (~7.0, 8.5, 17.4 and 18.9 μm). Note that the convolution parameters are the same as in Figures 4 and 5. |
Appendix D Abundance estimation from kinetics data for the construction of abundance-weighted IR spectra of PAH-C60 adducts
We have estimated the expected abundances of PAH-C60 adducts from the kinetics data previously reported. For the case of indenyl (C9H7), the data extracted from indene (C9H8) pyrolysis (Jin et al. 2019; Lifshitz et al. 2004; Pousse et al. 2010) has been used. Note that indene pyrolysis is also connected to the anthracene formation, through the following mechanism in the presence of cyclopentadiene (C5H6) (Mulholland et al. 2000):
![Mathematical equation: $\[\mathrm{C}_9 \mathrm{H}_8+\mathrm{C}_5 \mathrm{H}_6 \xrightarrow{-2 \mathrm{H}} \mathrm{C}_{14} \mathrm{H}_{12}\left(\mathrm{C}_9 \mathrm{H}_7-\mathrm{C}_5 \mathrm{H}_5\right) \xrightarrow{-2 \mathrm{H}} \mathrm{C}_{14} \mathrm{H}_{10}\]$](/articles/aa/full_html/2025/12/aa54031-25/aa54031-25-eq41.png)
Therefore, with the exception of pentacene for which not kinetic data is available, it is possible to roughly estimate the expected abundances of PAH-C60 adducts by using the corresponding equations, knowing that they follow a second order rate law:
![Mathematical equation: $\[[\mathrm{A}]=\frac{[\mathrm{A}]_0}{1+\mathrm{kt} \cdot[\mathrm{~A}]_0}\]$](/articles/aa/full_html/2025/12/aa54031-25/aa54031-25-eq42.png) (D.1)
(D.1)
where k is the rate constant, [A] is the concentration of the reactant at a given time t and [A]0 is the initial concentration of the reactant. In order to apply Equation D.1 we have assumed the following assumptions:
The PAH-C60 abundances depend only on the PAH abundance.
The abundances of the Iyl-C60 and An-C60 adducts depend only on the indene abundance, following the pyrolysis mechanism mentioned above.
The initial abundance [A]0 of indene is obtained from the column density estimates towards the cold dark cloud TMC-1 reported by Cernicharo et al. (2021) and Burkhardt et al. (2021), which are 1.6 × 10¹³ and 0.96 × 1013 cm−2, respectively14.
The transition from mono- to bis-adducts follows the same kinetics as from bis- to tris-adducts, using as reference the solid state kinetics of InC60 by Rodrigues et al. (2023).
According to the above-mentioned principles we have determined the PAH abundances of indenyl, anthracene and tetracene from indene in order to estimate the corresponding PAH-C60 adducts abundances. For this purpose, we refer again to Equation D.1, where it can be noticed that the timescale (t) has to be introduced. This timescale can be first computed from the indene pyrolisis (Mulholland et al. 2000) using the half-life time expression:
![Mathematical equation: $\[\mathrm{t}_{1 / 2}=\frac{1}{\mathrm{k}[\mathrm{~A}]_0}\]$](/articles/aa/full_html/2025/12/aa54031-25/aa54031-25-eq43.png) (D.2)
(D.2)
we remind that in Equation D.2 [A]0 is the indene abundance from Cernicharo et al. (2021) and Burkhardt et al. (2021). Using the value in t1/2 and the experimental constant rates (k) of the PAH-C60 adducts we can determine [A] and [A]0 for indene and anthracene. For indenyl, we directly used the result obtained from the indene pyrolisis, while for the case of the tetracene adducts we have used the relation of the constant rates with anthracene (see Tables 1 and 2 in Sarova & Berberan-Santos 2004):
![Mathematical equation: $\[\mathrm{k}_{\mathrm{TnC}_{60}}=1.94 \cdot 10^2 \mathrm{k}_{\mathrm{AnC}_{60}}\]$](/articles/aa/full_html/2025/12/aa54031-25/aa54031-25-eq44.png) (D.3)
(D.3)
It should be noted that [A] and [A]0 the reactants, and thus the abundances of products must be derived from [A]prod=[A]0-[A], which describes how much of the reactant has become a product. Table D.1 displays the estimated expected abundance for each PAH-C60 adduct under study. Clearly, from the listed values, the abundances of anthracene and tetracene were negligible compared to the ones of indene and indenyl.
Estimated abundances (concentrations) for the different PAH-C60 adducts.
On the other hand, we also considered the probability of formation according to the thermodynamic stability of PAH-C60 adducts and its influence on the IR spectra. For this, a Boltzmann distribution (equation D.4 below) has been used to weight the different regioisomers for the bis- and tris-adducts (see Table 2), which is described as:
![Mathematical equation: $\[\mathrm{P_i=\frac{e^{-\Delta H_f^i / k T}}{\sum_{j=1}^M e^{-\Delta H_f^j / k T}}}\]$](/articles/aa/full_html/2025/12/aa54031-25/aa54031-25-eq49.png) (D.4)
(D.4)
with ![Mathematical equation: $\[\Delta \mathrm{H}_{\mathrm{f}}^{\mathrm{i}}\]$](/articles/aa/full_html/2025/12/aa54031-25/aa54031-25-eq50.png) being the Enthalpy of formation of the bis- or trisadduct, M the maximum number of regioisomers, T the temperature and k the Boltzmann constant. Note that Pi = 1 for the 2AnC60 and 2TnC60 adducts because no regioisomers were considered. We also note that ΔGf = ΔHf − TΔSf is the expression that connects these ΔHf values with the ΔGf ones in Table 2; both were calculated at 300 K and are directly extracted from our quantum-chemistry calculations. By using the quantities obtained so far, the IR intensity for each PAH-C60 adduct is thus computed by the following expression:
being the Enthalpy of formation of the bis- or trisadduct, M the maximum number of regioisomers, T the temperature and k the Boltzmann constant. Note that Pi = 1 for the 2AnC60 and 2TnC60 adducts because no regioisomers were considered. We also note that ΔGf = ΔHf − TΔSf is the expression that connects these ΔHf values with the ΔGf ones in Table 2; both were calculated at 300 K and are directly extracted from our quantum-chemistry calculations. By using the quantities obtained so far, the IR intensity for each PAH-C60 adduct is thus computed by the following expression:
![Mathematical equation: $\[\mathrm{I} \propto \mathrm{P}_{\mathrm{i}} \cdot[\mathrm{~A}]_{p r o d} \cdot \frac{\partial \mu}{\partial \mathrm{x}}\]$](/articles/aa/full_html/2025/12/aa54031-25/aa54031-25-eq51.png) (D.5)
(D.5)
It is important to note here that ∂μ/∂x it is the change in dipole moment (∂μ) as a function of the displacement produced by the vibration or vibrational mode (∂x). This ∂μ/∂x is the IR cross section as determined from our quantum-chemistry calculations; i.e. without convolving with any peak profile function (Lorentzian, Gaussian, etc.). Finally, the abundance-weighted PAH-C60 mixture spectra (displayed in Figures 6b and c) were constructed by summing the individual weighted PAH-C60 adduct IR spectra; as obtained for the two initial abundances [A]0 of indene from Cernicharo et al. (2021) and Burkhardt et al. (2021). Evidently, due to [A]prod and Pi PAH-C60 adducts had a lower/higher contribution to the abundance-weighted spectra.
Appendix E Details on the 1TnC60 mono-adduct configuration
Structurally, it is possible to build two mono-adduct configurations for 1TnC60, bonding the PAH by a symmetric or asymmetric attachment (see Figure E.1). The symmetric model represented in Figure E.1 was much more thermodynamically unstable than its asymmetric counterpart. Since we have established the possible formation of 1TnC60 through an exohedral cycloaddition, the binding to C60 occurred inside an hexagon ring instead on the CC bond bridging the fused rings, which corresponded to the asymmetric model. In addition, the asymmetric model was in agreement with previous experimental studies that suggest that tetracene binds C60 in such a way (Sarova & Berberan-Santos 2004).
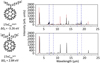 |
Fig. E.1 Left: Representation of the 1TnC60 mono-adduct models in their asymmetric |
![Mathematical equation: $\[\left(1 \mathrm{TnC}_{60}^{\text {asym}}\right)\]$](/articles/aa/full_html/2025/12/aa54031-25/aa54031-25-eq52.png)
![Mathematical equation: $\[\left(1 \mathrm{TnC}_{60}^{\text {sym}}\right)\]$](/articles/aa/full_html/2025/12/aa54031-25/aa54031-25-eq53.png)
Appendix F High-resolution windows of PAH-C60 adduct spectra
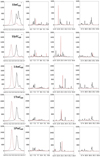 |
Fig. F.1 High-resolution windows of the more stable mono-adducts presented in Figure 4. Red dotted lines represent the free PAHs. |
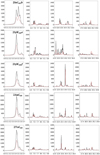 |
Fig. F.2 High-resolution windows of the more stable bis-adducts presented in Figure B.1. |
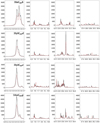 |
Fig. F.3 High-resolution windows of the more stable tris-adducts presented in Figure C.1. |
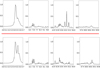 |
Fig. F.4 High-resolution windows of the summed quantum-chemical spectra (top) and the abundance-weighted spectra (bottom) presented in Figure 6. |
All Tables
All Figures
|
Fig. 1 Structure of several PAHs considered to build PAH-C60 adducts. The chemical formula, name, and notations are also displayed. |
| In the text | |
|
Fig. 2 Three archetypal PAH-C60 adducts synthesized by supramolecular mask strategy and used for the scaling factors’ validation: 1AnC60 (mono-anthracene), 2AnC60 (bis-anthracene), and 1PnC60 (monopentacene) (see Pujals et al. 2022, for more details). The notation follows the legend in Figure 1, adding the number of PAH units and the C60 identification. |
| In the text | |
|
Fig. 3 Experimental (red) versus scaled harmonic B3LYP-D3/6-31+G* (black) spectra for the three archetypal PAH-C60 adducts used for the scaling factors’ validation: 1AnC60, 2AnC60, and 1PnC60 (Fig. 2). The experimental spectra of the pristine PAHs (light blue) are included to ease the discussion. (a) Spectra built from scaling factors in Table 1. (b) Spectra built from empirical-corrected scaling factors for wavelengths <5 μm (>2000 cm−1) (see the text for more details). The similarity score value for each case is also indicated. The theoretical spectra were constructed in the wavenumber scale by the convolution of a Lorentzian function with FWHM = 4 cm−1 in order to ease the comparison with the experimental spectra. |
| In the text | |
|
Fig. 4 Scaled theoretical IR spectra of mono PAH-C60 adducts (one PAH unit: C60-CxHy) modeled at the B3LYP-D3/6-31+G* level. All spectra were convolved with a Lorentzian function of FWHM = 0.02 μm. In the case of 2H-indene (In) and indenyl (Iyl), the blue and red arrows highlight the binding of the PAH with a pentagon and hexagon ring to the C60 cage, respectively. For indenyl, with a single bond connecting its pentagon to C60, a green arrow has been used instead. In all panels, the dashed red spectra correspond to the isolated pristine PAH, while the dashed blue lines mark the four strongest C60 features (~7.0, 8.5, 17.4, and 18.9 μm). The black arrows on the spectra indicate those characteristic features (specific of each adduct), which are free of contribution from C60, the pristine PAH and even from the other adducts. |
| In the text | |
|
Fig. 5 Theoretical scaled IR spectra of PAH-C60 bis-adducts from 2H-indene (2InC60, a–c) and indenyl (2IylC60, d and e). The dashed red spectra correspond to the mono-adduct analogues, while the dashed blue lines mark the four strongest C60 features (~7.0, 8.5, 17.4, and 18.9 μm). Note that the convolution parameters are the same as in Figure 4. For a detailed discussion on the models and spectral features we refer to Appendix B. |
| In the text | |
|
Fig. 6 DFT-simulated IR (~3–25 μm) spectra of the mixture of PAH-C60 adducts. (A) Total (summed) mixture spectrum; (B): total abundance-weighted spectrum using the indene abundance from Burkhardt et al. (2021); and (C) total abundance-weighted spectrum using the indene abundance from Cernicharo et al. (2021). In all panels, the dashed red lines mark the most common astronomical PAH features (at ~3.3, 6.2, 7.7, 8.6, 11.2, and 12.7 μm), instead dashed blue lines mark the four strongest C60 features (~7.0, 8.5, 17.4, and 18.9 μm. In the case of the total (summed) mixture spectrum, the intensity has been normalized to the maximum intensity peak, while the abundance-weighted spectra have been normalized with respect to the higher intensity peak from the weighted spectrum (C); i.e., the one using the indene abundance from Cernicharo et al. (2021). |
| In the text | |
|
Fig. B.1 Left: Models of the PAH-C60 bis-adducts after geometry optimization for the PAHs 2H-indene (2InC60, a-c), indenyl (2IylC60, d-g), anthracene (2AnC60, h), and tetracene (2TnC60, i). In the case that the bis-adduct has different configurations (isomers), the most stable structure is highlighted with a red asterisk. Right: The theoretical IR spectra corresponding to the bis-adducts structures a-i presented in the left panel. In all panels, the red dashed spectra correspond to the mono-adduct analogous, while the blue dashed lines mark the four strongest C60 features (~7.0, 8.5, 17.4 and 18.9 μm). Note that the convolution parameters are the same as in Figures 4 and 5. |
| In the text | |
|
Fig. C.1 Left: Models of the PAH-C60 tris-adducts after geometry optimization for the PAHs 2H-indene (3InC60, a-b), indenyl (3IylC60, c-e) and anthracene (3AnC60, f-g). In the case that the tris-adduct has different configurations (isomers), the most stable structure is highlighted with a red asterisk. Right: The theoretical IR spectra corresponding to the tris-adducts structures a-g presented in the left panel. In all panels, the red dashed spectra correspond to the bis-adduct analogous, while the blue dashed lines mark the four strongest C60 features (~7.0, 8.5, 17.4 and 18.9 μm). Note that the convolution parameters are the same as in Figures 4 and 5. |
| In the text | |
|
Fig. E.1 Left: Representation of the 1TnC60 mono-adduct models in their asymmetric |
| In the text | |
|
Fig. F.1 High-resolution windows of the more stable mono-adducts presented in Figure 4. Red dotted lines represent the free PAHs. |
| In the text | |
|
Fig. F.2 High-resolution windows of the more stable bis-adducts presented in Figure B.1. |
| In the text | |
|
Fig. F.3 High-resolution windows of the more stable tris-adducts presented in Figure C.1. |
| In the text | |
|
Fig. F.4 High-resolution windows of the summed quantum-chemical spectra (top) and the abundance-weighted spectra (bottom) presented in Figure 6. |
| In the text | |
Current usage metrics show cumulative count of Article Views (full-text article views including HTML views, PDF and ePub downloads, according to the available data) and Abstracts Views on Vision4Press platform.
Data correspond to usage on the plateform after 2015. The current usage metrics is available 48-96 hours after online publication and is updated daily on week days.
Initial download of the metrics may take a while.