Open Access
Fig. E.1
Download original image
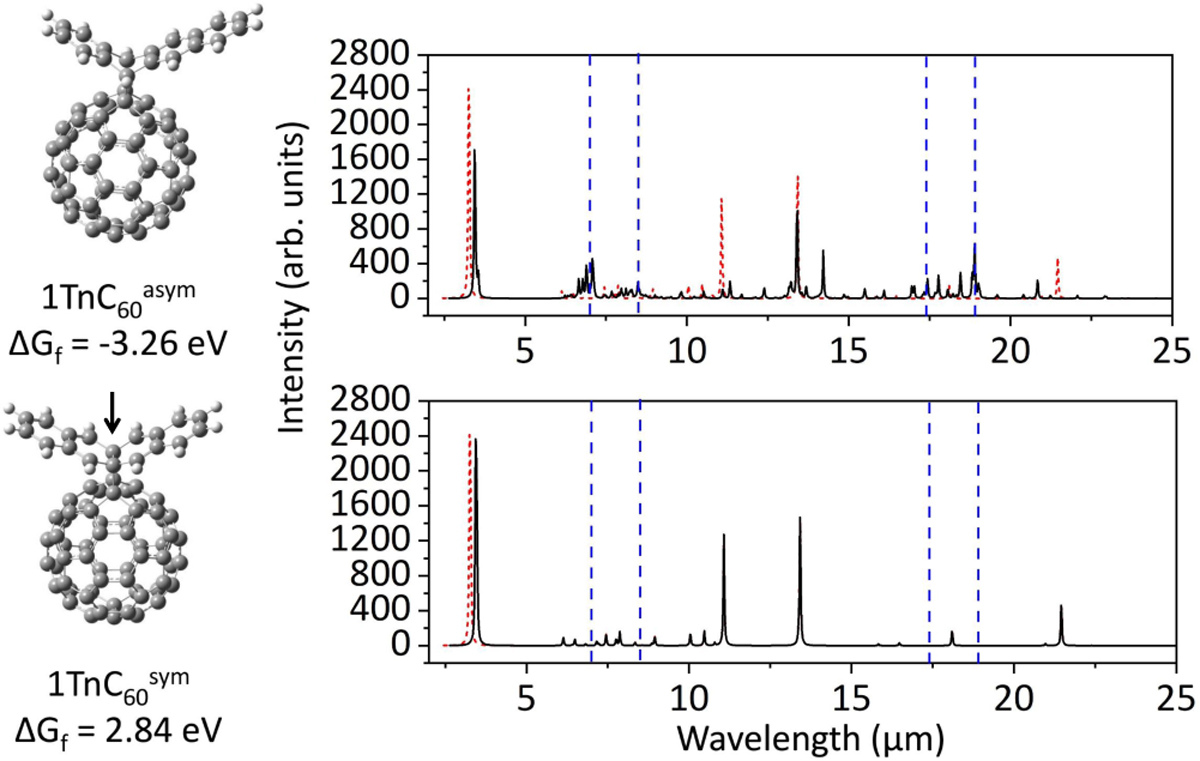
Left: Representation of the 1TnC60 mono-adduct models in their asymmetric ![]() and symmetric
and symmetric ![]() binding configurations. The corresponding Gibbs free energies of formation are indicated. Right: The theoretical IR spectra for each 1TnC60 mono-adduct configuration.
binding configurations. The corresponding Gibbs free energies of formation are indicated. Right: The theoretical IR spectra for each 1TnC60 mono-adduct configuration.
Current usage metrics show cumulative count of Article Views (full-text article views including HTML views, PDF and ePub downloads, according to the available data) and Abstracts Views on Vision4Press platform.
Data correspond to usage on the plateform after 2015. The current usage metrics is available 48-96 hours after online publication and is updated daily on week days.
Initial download of the metrics may take a while.