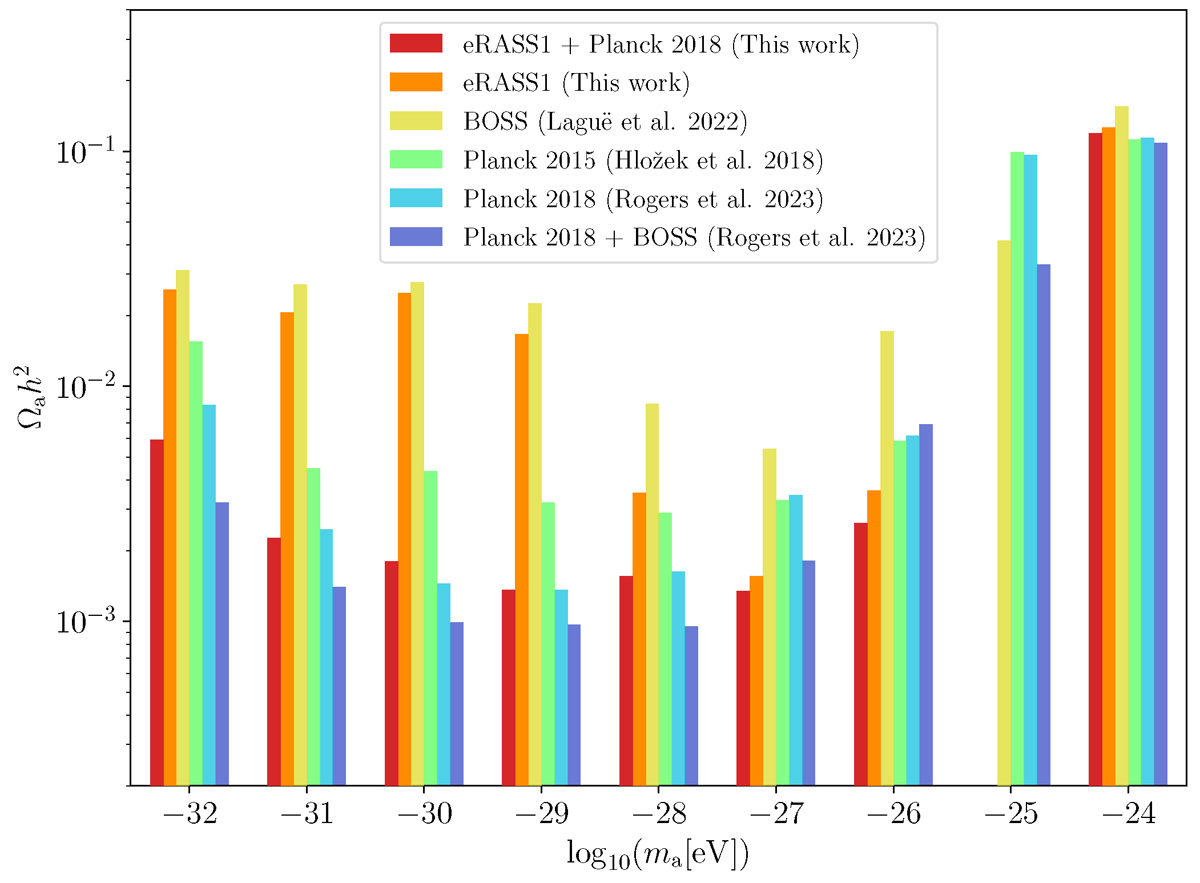
Fig. 10.
Download original image
Comparison of ULA constraints obtained from eRASS1 galaxy cluster abundance (this work), Planck 2015 (Hložek et al. 2018), and 2018 CMB data; BOSS galaxy clustering data (both by Rogers et al. 2023); and combined analyses of eRASS1 and Planck 2015 (this work) and Planck 2018 and BOSS (Rogers et al. 2023). The bar height indicates the 95% exclusion limits of the ULA density Ωa times h2 = (H0/100)2 in each log10(ma[eV]) bin. eRASS1 yields the tightest upper bounds on dark matter ultralight axions in the log10(ma[eV]) ∈ { − 27, −26} bins.
Current usage metrics show cumulative count of Article Views (full-text article views including HTML views, PDF and ePub downloads, according to the available data) and Abstracts Views on Vision4Press platform.
Data correspond to usage on the plateform after 2015. The current usage metrics is available 48-96 hours after online publication and is updated daily on week days.
Initial download of the metrics may take a while.