Fig. 12.
Download original image
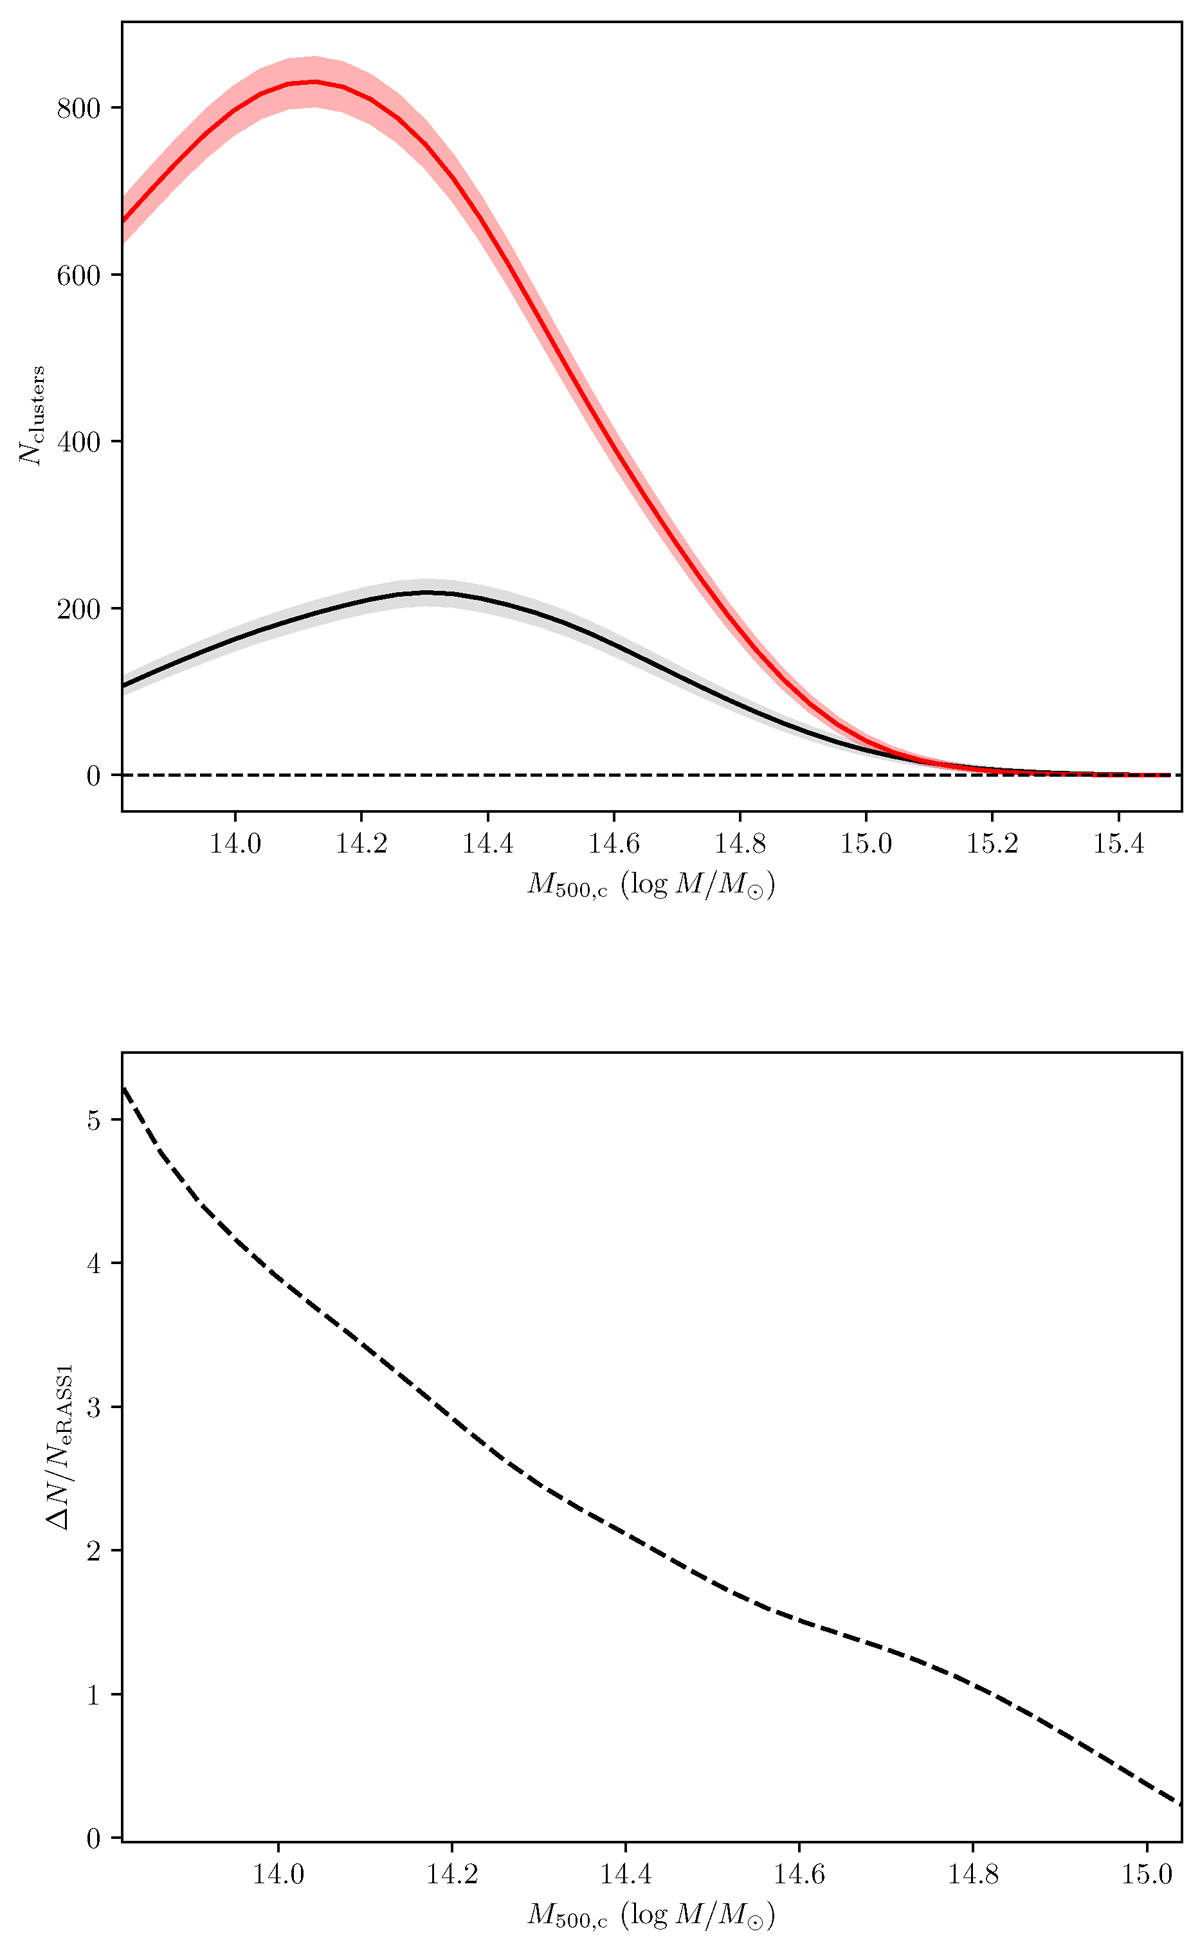
Forecasts for an eRASS:5 survey. Left: Number count of X-ray detected clusters for an eRASS:5 survey (red) compared with an eRASS1 catalog (black). The Poisson error bars are represented by filled lines. Right: Relative difference of eRASS:5 detected clusters and eRASS1 detected objects. eRASS:5 will contain five times more clusters at M = 1013.8 M⊙.
Current usage metrics show cumulative count of Article Views (full-text article views including HTML views, PDF and ePub downloads, according to the available data) and Abstracts Views on Vision4Press platform.
Data correspond to usage on the plateform after 2015. The current usage metrics is available 48-96 hours after online publication and is updated daily on week days.
Initial download of the metrics may take a while.