Fig. 3.
Download original image
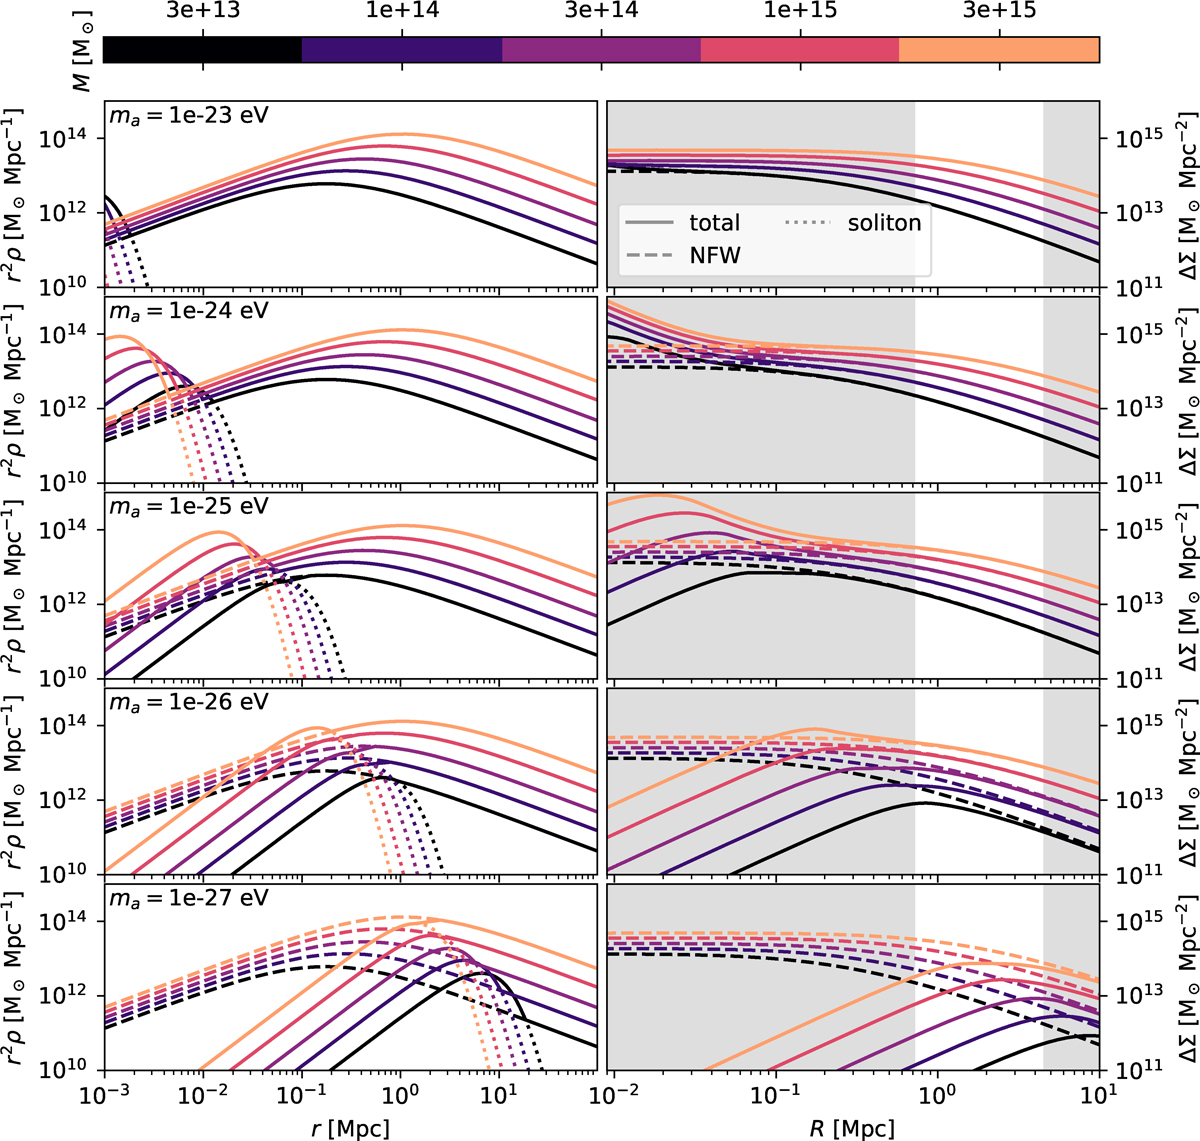
Density profiles (left column) and projected density contrasts (right column) of halos of different mass (color coded) at redshift z = 1 for different ULA particle masses (rows) in the extreme case of a ULA-only dark matter sector. Full lines show the total profiles, dashed lines show the corresponding cold dark matter profiles (assumed to follow a Navarro-Frenk-White profile), and dotted lines show the soliton core profile. In the right column, we highlight the scales we use for the weak lensing measurement in white.
Current usage metrics show cumulative count of Article Views (full-text article views including HTML views, PDF and ePub downloads, according to the available data) and Abstracts Views on Vision4Press platform.
Data correspond to usage on the plateform after 2015. The current usage metrics is available 48-96 hours after online publication and is updated daily on week days.
Initial download of the metrics may take a while.