Fig. 9.
Download original image
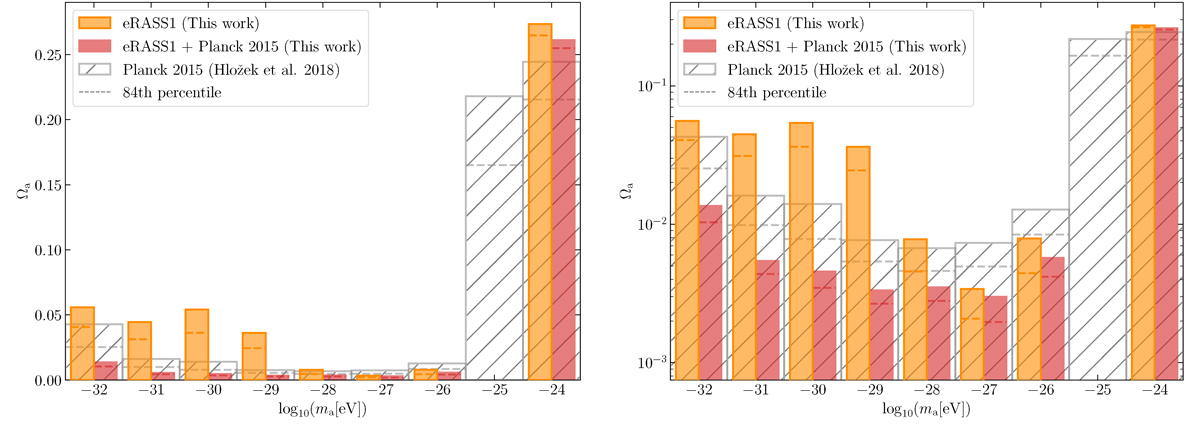
Upper bounds on the relative ULA density Ωa in each logarithmic ULA mass bin. The left plot shows the upper bounds on Ωa on a linear scale, and the right plot shows the upper bounds on a logarithmic scale. The bar height indicates the 95% confidence interval. The orange bars indicate the bounds obtained by eRASS1 galaxy clusters only, and the gray hatched bars show the bounds obtained from Planck 2015 CMB data by Hložek et al. (2018). The red bars show the bounds obtained from combining the bounds from eRASS1 galaxy clusters with those from Planck 2015 CMB data.
Current usage metrics show cumulative count of Article Views (full-text article views including HTML views, PDF and ePub downloads, according to the available data) and Abstracts Views on Vision4Press platform.
Data correspond to usage on the plateform after 2015. The current usage metrics is available 48-96 hours after online publication and is updated daily on week days.
Initial download of the metrics may take a while.