Fig. 5
Download original image
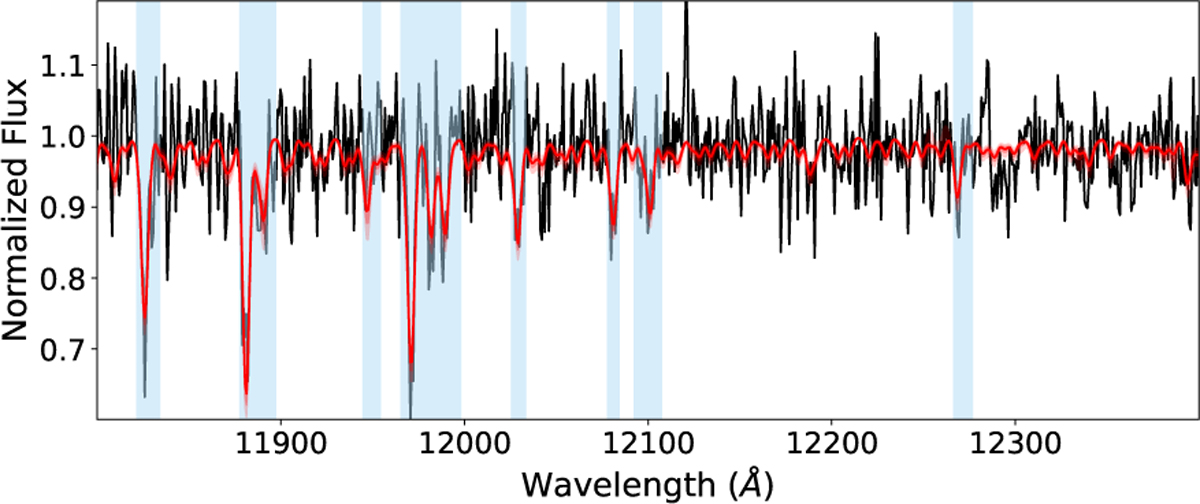
Observed spectrum of NGC 6822-103 (in black) and best-fitting model (in red). The shaded blue regions highlight the spectral windows considered for the fitting process. The lines used for the fitting process from left to right by species are Fe I λλ 11 882.847, 11 973.050; Ti I λλ 11 892.878, 11 949.542; Si I λλ 11 984.20, 11 991.57, 12 031.50, 12 103.54, 12 270.50; Mg I λλ 11 828.185, 12083.346.
Current usage metrics show cumulative count of Article Views (full-text article views including HTML views, PDF and ePub downloads, according to the available data) and Abstracts Views on Vision4Press platform.
Data correspond to usage on the plateform after 2015. The current usage metrics is available 48-96 hours after online publication and is updated daily on week days.
Initial download of the metrics may take a while.