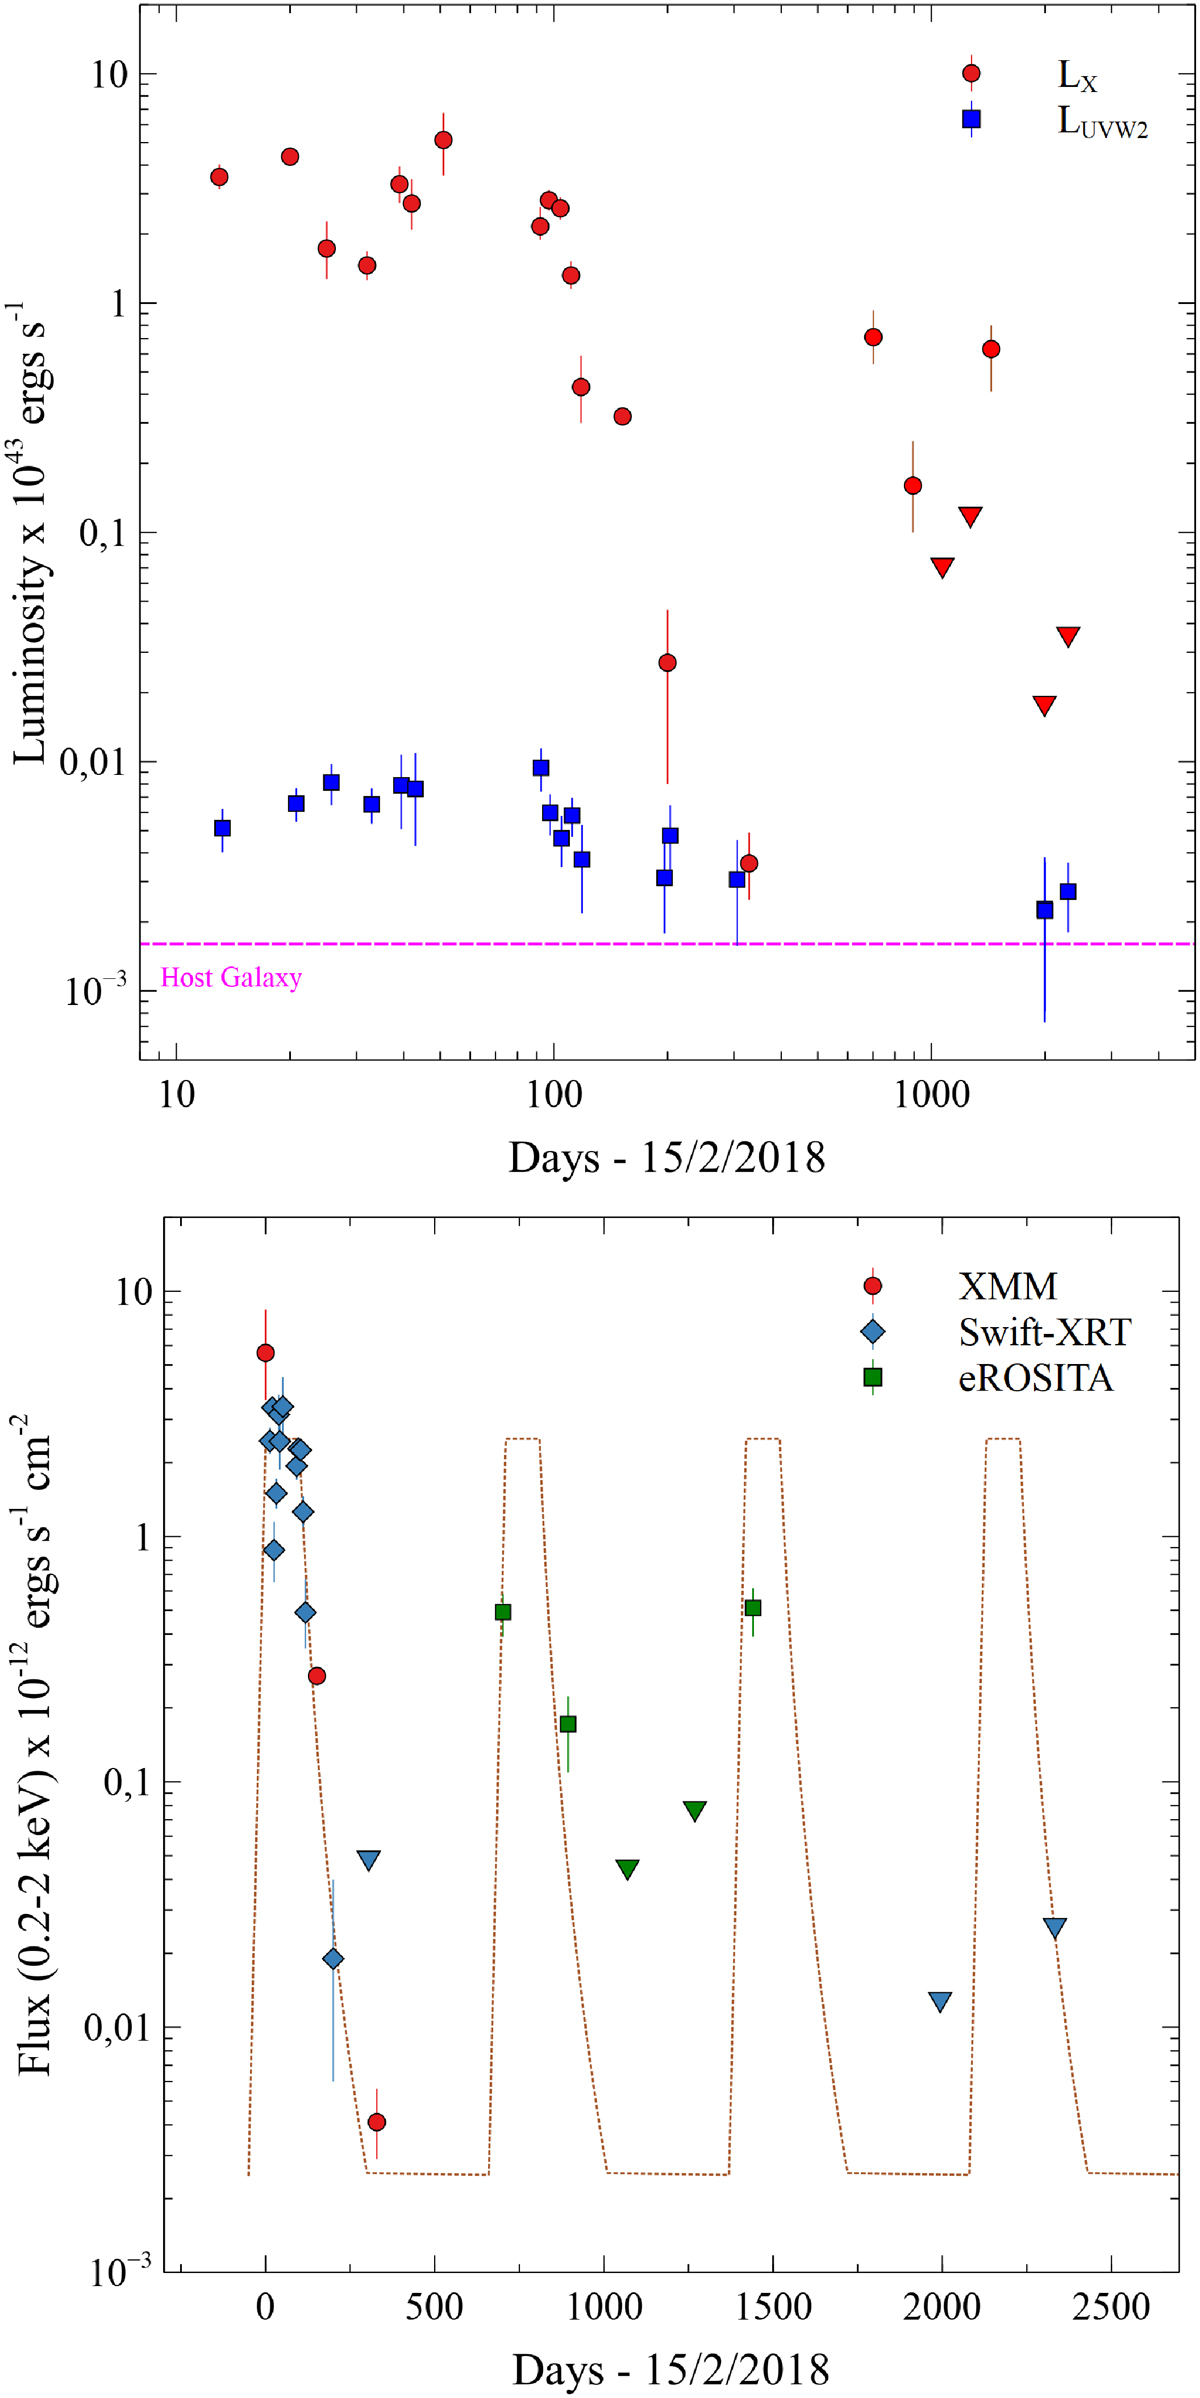
Fig. 11.
Download original image
Upper: X-ray (red circles) and host-subtracted, Galactic absorption-corrected, UVOT-UVW2 filter (blue squares) luminosity light curves. The modelled host galaxy UVW2 luminosity is shown for reference (pink dashed line), Lower: Full X-ray observed flux light curve calculated using the COMPBB model (see Table 3). The dotted line represents a flare consisting of a 50 day rise to a 100 day plateau of 2.5 × 10⁻¹² ergs s−1 cm−2 and a 200 day decay with index t−5, repeating every 710 days. Downward triangles denote 2-sigma upper limits.
Current usage metrics show cumulative count of Article Views (full-text article views including HTML views, PDF and ePub downloads, according to the available data) and Abstracts Views on Vision4Press platform.
Data correspond to usage on the plateform after 2015. The current usage metrics is available 48-96 hours after online publication and is updated daily on week days.
Initial download of the metrics may take a while.