| Issue |
A&A
Volume 704, December 2025
|
|
|---|---|---|
| Article Number | A165 | |
| Number of page(s) | 15 | |
| Section | Extragalactic astronomy | |
| DOI | https://doi.org/10.1051/0004-6361/202554193 | |
| Published online | 05 December 2025 | |
Rapid onset of a Comptonisation zone in the repeating tidal disruption event XMMSL2 J140446.9-251135
1
Telespazio UK for ESA, ESAC, Apartado 78, 28691 Villanueva de la Cañada, Madrid, Spain
2
Astrophysics & Space Institute, Schmidt Sciences, New York, NY 10011, USA
3
Space Telescope Science Institute, 3700 San Martin Drive, Baltimore, MD 21218, USA
4
Leiden Observatory, Leiden University, PO Box 9513 2300 RA Leiden, The Netherlands
5
Department of Astronomy and Steward Observatory, University of Arizona, 933 North Cherry Avenue, Tucson, AZ 85721-0065, USA
6
Max-Planck-Institut für extraterrestrische Physik, Gießenbachstraße 1, 85748 Garching, Germany
7
Centre for Astrophysics Research, Department of Physics, Astronomy and Mathematics, University of Hertfordshire, College Lane, Hatfield AL10 9AB, UK
8
University of Oxford, Dept. of Physics, Denys Wilkinson building, Keble road, OX1 3RU Oxford, UK
9
Centro de Astrobiología (CAB), CSIC-INTA, Camino Bajo del Castillo s/n, ESAC campus, 28692 Villanueva de la Cañada, Madrid, Spain
10
ESA, ESAC, Apartado 78, 28691 Villanueva de la Cañada, Madrid, Spain
11
SERCO for ESA, ESAC, Apartado 78, 28691 Villanueva de la Cañada, Madrid, Spain
12
Dept. of Physics and Astronomy, University of Leicester, Leicester LE1 7RH, UK
13
Department of Astrophysics/IMAPP, Radboud University P.O. Box 9010 6500 GL Nijmegen, The Netherlands
14
National Astronomical Observatories, Chinese Academy of Sciences, 20A Datun Road, Chaoyang District, Beijing 100101, China
⋆ Corresponding author: This email address is being protected from spambots. You need JavaScript enabled to view it.
Received:
19
February
2025
Accepted:
2
October
2025
Abstract
We report here on observations of a tidal disruption event (TDE), XMMSL2 J1404-2511, discovered in an XMM-Newton slew, in a quiescent galaxy at z = 0.043. X-ray monitoring covered the epoch when the accretion disc transitioned from a thermal state, with kT ∼ 80 eV, to a harder state dominated by a warm, optically thick corona. The bulk of the coronal formation took place within 7 days and was coincident with a temporary drop in the emitted radiation by a factor 4. After a plateau phase of ∼100 days, the X-ray flux of XMMSL2 J1404-2511 decayed by a factor 500 within 230 days. We estimate the black hole mass in the galaxy to be MBH = 4 ± 2 × 10⁶ M⊙ and the peak X-ray luminosity LX ∼ 6 × 1043 ergs s−1. The optical/UV light curve is flat over the timescale of the observations with Lopt ∼ 2 × 1041 ergs s−1. We find that TDEs with coronae are more often found in an X-ray sample than in an optically selected sample. Late-time monitoring of the optical sample is needed to test whether this is an intrinsic property of TDEs or is due to a selection effect. From the fast decay of the X-ray emission we consider that the event was likely due to the partial stripping of an evolved star rather than a full stellar disruption, an idea supported by the detection of two further re-brightening episodes, two and four years after the first event, in the SRG/eROSITA all-sky survey.
Key words: accretion / accretion disks / galaxies: individual: XMMSL2 J140446.9–251135 / galaxies: nuclei / X-rays: galaxies
© The Authors 2025
 Open Access article, published by EDP Sciences, under the terms of the Creative Commons Attribution License (https://creativecommons.org/licenses/by/4.0), which permits unrestricted use, distribution, and reproduction in any medium, provided the original work is properly cited.
This article is published in open access under the Subscribe to Open model. This email address is being protected from spambots. You need JavaScript enabled to view it. to support open access publication.
1. Introduction
A tidal disruption event (TDE) occurs when a star passes too close to a supermassive black hole (SMBH) and is disrupted by gravitational tidal forces (Hills 1975; Rees 1988; Ulmer 1999). Electromagnetic signals from TDEs have been detected at a wide range of wavelengths including radio (Alexander et al. 2020), infra-red (Jiang et al. 2016; Li et al. 2020), optical (Arcavi et al. 2014; Holoien et al. 2014; Hammerstein et al. 2023), UV (Gezari et al. 2003), and X-rays (Komossa & Bade 1999; Esquej et al. 2008). X-ray emission is thought to primarily come from an accretion disc about the SMBH (Rees 1990; Cannizzo et al. 1990; Komossa 2015; Mummery & Balbus 2020; Wen et al. 2020; Saxton et al. 2021) although shocks between streams (Piran et al. 2015) or between tidal streams and a forming accretion disc (Steinberg & Stone 2024) may contribute at early times, while interaction between out-flowing material and a pre-existing dense medium has been suggested to contribute on multi-year timescales (Mou et al. 2021).
When first observed, the X-ray spectrum can often be described purely by thermal disc emission with little or no hard X-ray emission from a corona (Komossa & Bade 1999; Holoien et al. 2016; Gezari et al. 2017; Guolo et al. 2024, see Mummery et al. 2023 for a sample). This is in contrast to active galactic nuclei (AGNs) where coronal emission is nearly ubiquitous (Svoboda et al. 2017; Laha et al. 2025), indicating a fundamental difference in the properties of newly formed TDE accretion discs from mature persistently fed discs. Many TDEs, particularly those discovered in optical surveys, remain in the thermal state throughout the whole of their monitoring (Guolo et al. 2024), sometimes in excess of a 1000 days (Bright et al. 2018; Wen et al. 2023; Wevers et al. 2024; Guolo & Mummery 2025). In some cases, higher cadence monitoring has revealed the formation of a harder component. AT2018fyk evolved from a thermal to power-law dominated spectrum in less than a hundred days (Wevers et al. 2021) while AT2021ehb gradually formed a dominant hard spectral component over 170 days which softened significantly within 3 days while the X-ray flux faded by an order of magnitude (Yao et al. 2022). Radio observations of these sources showed that the hard X-ray component is not related to a relativistic jet as was found to be the case for SWIFT J164449.3+573451 (Burrows et al. 2011; Bloom et al. 2011; Zauderer et al. 2013) (but see Christy et al. 2024). The interpretation is that hard X-rays are generated by the upscattering of disc photons by a corona (e.g. Wevers et al. 2019). It is unclear why this component only appears to develop in a minority of TDEs, although the time needed to magnetically build the corona may be a factor (Yao et al. 2022).
These events give a view of the dynamic evolution of accretion structure around SMBHs, which is otherwise only accessible in the rare changing-look AGN (CLAGN; Ricci & Trakhtenbrot 2023). State changes are particularly prevalent in partial TDEs (pTDE; Guillochon & Ramirez-Ruiz 2013), some of which show multiple peaks in their light curves indicating periodic stripping of material from an evolved star (Wevers et al. 2023; Liu et al. 2024). This can be understood in terms of each stripping providing a relatively low mass of material to the system, resulting in a rapid change of the accretion rate as material is consumed. Changes in accretion rate are believed to influence state changes seen in stellar mass black hole discs (Esin et al. 1997).
In this paper we describe a TDE discovered in the XMM-Newton slew survey, XMMSL2 J1404-2511, whose X-ray spectrum demonstrates a rapid buildup of the corona shortly after detection. In Section 2 we discuss the discovery of this TDE and the source identification; in Sections 3, 4 & 5 we present UV, optical, radio, and X-ray follow-up observations and in Section 6 we discuss the source characteristics within the TDE model. The paper is summarised in Section 7. A ΛCDM cosmology with (ΩM, ΩΛ) = (0.27,0.73) and H0 = 70 km−1s−1 Mpc−1 has been assumed throughout.
2. Discovery of XMMSL2 J1404-2511
A new source of X-rays, XMMSL2 J140446.9-251135 (hereafter XMMSL2 J1404-2511), was discovered by XMM-Newton (Jansen et al. 2001) while it slewed between targets on Feb 15 2018, with a count rate of 4.4 ± 1.1 c/s in the EPIC-pn camera (Read et al. 2018). The X-rays were located to a position RA: 14 04 46.68 DEC: -25 11 43.3 (±1.9 arcsecs; 90% confidence) by follow-up observations with the Neil Gehrels Swift observatory (henceforth Swift; Gehrels et al. 2004) and shown to be coincident with the galaxy 2MASX 14044671-2511433 (Fig. 1).
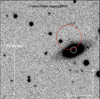 |
Fig. 1. Finder chart of XMMSL2 J1404-2511 based on an r’ band image from the Legacy DR10 survey performed on DECam on the Blanco CT10 telescope. Red circle is the XMM-Newton slew error circle of 8 arcseconds radius and the white circle is the Swift-UVOT enhanced position with an error of 1.9 arcseconds. |
The EPIC-pn slew spectrum was soft and could be fit with a black-body of  eV and 0.2–2 keV flux 5.6 × 10⁻¹² ergs s−1 cm−2 absorbed by the Galactic column of NH = 6.7 × 1020 cm−2 (Willingale et al. 2013). The ROSAT All Sky Survey (RASS) 2-sigma upper limit from 1990 was 0.033 c/s equating to a flux of < 5 × 10⁻¹³ergs s−1 cm−2 using the same spectral model, a factor > 10 lower than the slew detection.
3. Optical and UV follow-up
An optical spectrum was taken by the New Technology Telescope (NTT) within the ePESSTO program (Smartt et al. 2015) on 2018-03-08 revealing a quiescent galaxy with no emission lines at redshift z = 0.043 ± 0.001 (Taubenberger et al. 2018; Fig. 2). A further optical spectrum was taken with the MagE instrument on the Magellan telescope with a 0.7 arcsecond slit on 2020-02-15 (Wevers 2020; Fig. 3). Blaze corrections were performed for each individual échelle order by fitting a low order spline function to regions devoid of absorption and emission lines, after which the spectrum was stitched together using an inverse variance weighting scheme for overlapping wavelength ranges between orders. Following the procedures outlined in Wevers et al. (2017), the Penalized Pixel fitting routine (Cappellari 2017) was used in combination with the Elodie stellar template library (Prugniel et al. 2007) to measure the velocity dispersion of this continuum normalized spectrum, correcting for the instrumental broadening of σinst = 22 km s−1. A velocity dispersion of 93 ± 1 km/s was measured. Using the M − σ relation of Gültekin et al. (2009) a black hole mass of log10(MBH) = 6.71 ± 0.4 M⊙ is obtained with the error dominated by the systematic error of the method1.
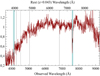 |
Fig. 2. Optical spectrum of 2MASX 1404-25 taken with the NTT on 2018-03-08 as part of the ePESSTO program. |
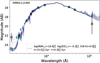 |
Fig. 3. Host galaxy photometry based on GALEX (Martin et al. 2005), DECaLS (Dey et al. 2019), and WISE (Wright et al. 2010; Mainzer et al. 2011). We also include the post-peak aperture photometry in the UVOT B- and U-band. We show samples from the posterior distribution of population synthesis galaxy models (Conroy et al. 2009; Johnson & Leja 2017), following the method outlined in van Velzen et al. (2021). The predicted magnitudes (including UVOT W1, M2, and W2) are shown with open circles. |
Photometric observations were made with the Swift ultraviolet telescope (UVOT; Table 1) and with the XMM-Newton optical monitor (XMM-OM). In both telescopes the B, U, UVW1, UVM2, and UVW2 filters were used and UVOT also observed with the V filter (Fig. 4). The galaxy was faint being detected in all of the UVOT filters but not in the XMM-OM camera in the UVW2 or UVM2 filters. The UV temperature, obtained by fitting all UVOT data simultaneously to a power-law decay and a single black-body is T = 104.4 ± 0.1 K, which is at the high end of the distribution of temperatures seen in a sample of 30 spectroscopically classified ZTF TDEs (Hammerstein et al. 2023). The black-body integrated optical/UV luminosity of Lbb ∼ 2 × 1041ergs s−1 evolves slowly and if the optical emission did have a peak then that peak would have occurred well before the first X-ray observation (Fig. 4).
Swift-UVOT observations of XMMSL2 J1404-2511.
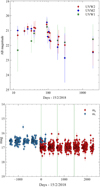 |
Fig. 4. Light curve of XMMSL2 J1404-2511 in the Swift-UV filters (upper) and in V and G filters from the ASAS-SN Sky Patrol v2.0 project (Hart et al. 2023; Shappee et al. 2014) (lower) where the vertical green lines indicate the dates of the three flares seen in X-ray data. Magnitudes represent the host galaxy light, which dominates in the optical filters, plus light from the TDE which dominates in the UV. |
The Galaxy Evolution Explorer (GALEX) catalogue (Bianchi et al. 2017) contains a source (GALEX J140446.5-251140) at an offset of 4 arcseconds from 2MASX 1404-25, detected in the NUV filter with magnitude 21.81 ± 0.65 on 2007-05-12 but undetected in the FUV filter. Historical optical observations from the All-Sky Automated Survey for SuperNovae (ASAS-SN; Shappee et al. 2014) are flat from 2014 until 2022, although we note that the light curve has a gap between 2017-08-19 and 2017-12-17 (Fig. 4). No Gaia science alert 2 was triggered for XMMSL2 J1404-2511 also indicating that the source has not brightened by more than 1 magnitude in the Gaia G band since the alerts started in 2016 (Hodgkin et al. 2021).
4. Radio observations
XMMSL2 J1404-2511 was observed with NSF’s Karl G Jansky Very Large Array (VLA) at a mean frequency of 6 GHz on 2018 March 23 and again on 2018 September 8 under program 18A-453 (PI: Alexander). In the first observation the VLA was in its highest resolution A configuration, while in the second it was in its lowest resolution D configuration. Both observations used 3C286 as the flux calibrator and J1409-2657 as the phase calibrator and the data were reduced in CASA following standard procedures. XMMSL2 J1404-2511 was not detected in either observation, with 3σ limits of 14 μJy and 35 μJy respectively.
5. X-ray observations and long-term light curve
After discovery, a monitoring program was immediately initiated with Swift with a cadence of one observation per week. Despite being discovered in an XMM-Newton slew, the source had formally left the XMM-Newton visibility window at the time and could only be observed by XMM-Newton in a pointed observation five months later (OBSID = 0804860201). A second pointed observation was made after a further six months (OBSID = 0804860301). The full list of X-ray observations is given in Table 2.
X-ray observation log of XMMSL2 J1404-2511.
Swift spectral products were extracted using the on-line XRT data products tool available from the UK Swift Data centre (Evans et al. 2009). As another source lies at ∼1 arcminute from XMMSL2 J1404-2511 we entered the source coordinates for the fainter observations to avoid problems with the centroiding routine. A brief analysis of the secondary source spectrum is presented in Appendix A.
Data from the first XMM-Newton observation were reduced using SAS 18.0 (Gabriel et al. 2004). Source products were extracted from a circle of radius 27 arcseconds about the source and a local background was taken from the same CCD. The background was low throughout the observation and flare screening was not applied. We restricted our analysis to the EPIC-pn camera.
The long-term 0.2–2 keV observed flux light curve is given in Fig. 5 and can be characterised by a flat flux level for the first 100 days followed by a decay of t−5.2 ± 0.2. A similar 100-day initial flat period followed by a constant decay was seen in XMMSL1 J1446+68 (Saxton et al. 2019), although the rate of decline is considerably steeper in XMMSL2 J1404-2511, of the order of a factor 500 in 230 days. This decay is notably faster than observed in most previous events (Auchettl et al. 2017) including ASSASN-14li (Brown et al. 2017; Wen et al. 2020).
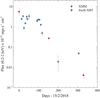 |
Fig. 5. Observed soft X-ray (0.2-2 keV) flux light curve of XMMSL2 J1404-2511 during 2018 and 2019. XMM-Newton points are shown as red circles and Swift-XRT points as blue diamonds or a blue downward triangle for the upper limit. Fluxes have been calculated using the spectral model COMPBB (see Table 3). |
Fits of a Comptonised black-body to XMM-Newton, Swift-XRT and SRG/eROSITA observations of 2MASX 1404-25.
5.1. X-ray spectral analysis
The early Swift-XRT observations of 2018-02-28 and 2018-03-07 can be well fit with a single black-body model of temperature kT ∼ 80 eV, absorbed by the Galactic column of NH = 6.7 × 1020 cm−2. TDEs at the peak of their emission commonly show a similar thermal spectrum (Komossa & Bade 1999; Esquej et al. 2008; Brown et al. 2017; Guolo et al. 2024). However, in subsequent observations the spectrum of XMMSL2 J1404-2511 hardened and became more complex. As an illustration, in Fig. 6 we show the evolution of the Swift-XRT spectrum between the observations of 2018-02-28 and 2018-03-19, where the hardening is very evident. To visualise the evolution of the spectrum, we parameterise the hardness of the X-ray spectrum over the full range of observations by the slope returned in a simple fit of a power-law, absorbed by the Galactic column, to the 0.3-10 keV spectra from XMM-Newton and Swift-XRT (Fig. 7). This model does not give a particularly good fit but clearly illustrates the evolution as the spectral index drops from Γ ∼ 5.5, twenty days after discovery, to a minimum of Γ < 3 on days 100–120. Alternatively, we can parameterise the spectral hardness by fitting a single absorbed black-body to the same spectra (Fig. 7). The temperature of the black-body apparently increases from ∼80 eV until it peaks at ∼200 eV between days 100–120, in parallel with the changes seen in the power-law slope. We will see later that this does not represent the real temperature of the disc emission and point out here that care must be taken when interpreting measured X-ray temperatures in terms of real-world parameters, especially in low s/n spectra. In both parameterisations, the three observations taken between days 150 and 329 (X1,S13-16,X2) show tentative evidence for a softening of the spectrum; this is most obvious in the simple power-law fit where the slope steepens from 2.8 (in S12) to 3.6 (in X1).
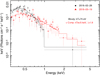 |
Fig. 6. Swift-XRT spectra of XMMSL2 J1404-2511 from 2018-02-28 fitted with a black-body (black) and 2019-03-19 fitted with a COMPBB model (red). |
 |
Fig. 7. Left: Slope of a power-law model absorbed by the Galactic column fitted to the X-ray spectra of XMMSL2 J1404-2511. Red points are from XMM-Newton, blue points from Swift-XRT. Middle: Temperature (eV) of a simple model of a black-body absorbed by the Galactic column of NH = 6.7 × 1020 cm−2 fitted to the X-ray spectra of XMMSL2 J1404-2511. Note that this does not represent the physical temperature of the disc but illustrates how the spectrum hardens with time. Right: Optical depth of a 5 keV electron population derived from fits of a COMPBB model, absorbed by the Galactic column, to X-ray spectra of XMMSL2 J1404-2511 from 2018 and 2019. |
A visual inspection of Fig. 6, shows that the flux below 0.7 keV declined between 2018-02-28 and 2018-03-19, while the flux above 0.7 keV increased. This immediately suggests that the soft photons have been reprocessed into harder photons.
We used the high-statistic XMM-Newton observation of 2018-07-17 (day 150), using the EPIC-pn data, grouped to have a minimum of 25 counts in each spectral bin, to investigate the spectral model. Spectral fits were performed with XSPEC v12.13.1 (Arnaud 1996). All fits include absorption by the Galactic column (NH = 6.7 × 1020 cm−2) with Wilm abundances (Wilms et al. 2000).
First we tried single models, finding a poor fit with an absorbed black-body ( ), bremsstrahlung (
 ) or a multi-colour disc (DISKBB model;
  ). A power-law proved a better fit (
 , with Γ = 3.63 ± 0.05). A good fit (
 ) was given by a black-body Comptonised by a warm electron population (COMPBB; Nishimura et al. 1986) with a rest-frame black-body temperature of
  eV, electron temperature
  keV, optical depth
  and normalisation of 5.3 × 10⁴. This model treats soft X-ray photons Compton-scattered by a plane-parallel plasma. Switching to a different Comptonisation model (THCOMP; Zdziarski et al. 2020) gave a similar quality fit with comparable temperatures and optical depth.
As a further check, we added an extra component of intrinsic cold absorption (ztbabs), at the redshift of the source, finding no improvement in the fit ( ; NH < 1.5 × 1020 cm−2). A warm absorber (absori; Done et al. 1992; Magdziarz & Zdziarski 1995) likewise gave no significant improvement (
 ).
).
We then applied the COMPBB model to the lower-statistic Swift-XRT observations, fixing the electron temperature to kTe = 5 keV. We choose this temperature as being close to the centre of the allowed range from the XMM-Newton observation and note that it is hotter than the 0.1–1.0 keV temperature derived for the soft excess in a sample of AGNs (Petrucci et al. 2018) but well below the temperature of the hot corona (e.g. Akylas & Georgantopoulos 2021). Results are presented in table 3. The evolution of the optical depth of the electron corona is shown in Fig. 7 and jumps from τ < 0.4 to an optical depth τ > 1.6 in 12 days between 2018-02-28 and 2018-03-12 or from τ = 0.4 ± 0.3 to  in 5 days from 2018-03-07 to 2018-03-12. Overall the corona went from being undetectable to being fully formed, with a depth τ = 2.9 ± 0.5, in 29 days between 2018-02-28 and 2018-03-29. Over the set of observations, the observed temperature of the disc emission dropped from ∼80 eV in the early Swift observations to kT = 50 ± 10 eV (with kTe fixed at 5 keV) in the XMM-Newton observation of 2018-07-17 (Table 3).
As an alternative, we investigated whether a high-temperature (fixed to 70 keV), low optical depth, Comptonisation model could also fit the X1 spectrum. Using the COMPBB model the fit is bad (267/145), but changing to the COMPTT model (Titarchuk 1994) does allow a reasonable high-temperature (frozen to 70 keV), τ = 0.015 ± 0.003 fit to the EPIC-pn data ( ). As noted elsewhere (e.g. Akylas & Georgantopoulos 2021; Tamborra et al. 2018), extracting physical parameters for the electron population in the corona is very model dependent unless a high-energy break is available to constrain the electron temperature.
To further probe the intrinsic disc parameters, we used a physically motivated disc model TDEDISCSPEC (Mummery 2021). This models the disc as the sum of emission from a set of concentric regions, each with their own temperature and area, and with the intrinsic emission colour-corrected to model disc effects such as opacity (Mummery et al. 2023). It has two main parameters; TP, the intrinsic peak disc temperature before colour-correction effects are applied, and RP, the disc radius where the peak temperature is emitted. We applied this model to the first Swift-XRT observation (S1), which is the only good-quality spectrum we have which is purely thermal. This fits the spectrum well (Cr = 40/50) giving a best-fit radius  cm and peak temperature
  K (
K ( eV), when we fix the index (γ = 0.5) and the luminosity distance to DL = 190 Mpc. For the second Swift-XRT observation (S2), to model the Comptonisation we adopted the SIMPL model (Steiner et al. 2009), which links an arbitrary seed spectrum to an output power-law. This has three parameters, a power-law slope Γ, the fraction of seed photons which are scattered fc and a flag which we set so that only upscattering of photons is considered. This gave a similar quality fit to the COMPBB model with Cr = 89/65,
  cm and peak temperature
  K and fc < 0.05. From observation S3 onwards, the Comptonisation component becomes large and we find that fits with the TBABS*SIMPL*TDEDISCSPEC model return values of RP and TP which are unconstrained. A similar effect was noted by Guolo et al. (2024) who found that such fits become unreliable when fc > 0.2.
To break the degeneracy, we use the relation found in Mummery et al. (2023) between RP and black hole mass, RP, 12 = MBH, 6/4.9, where RP, 12 is the radius of the peak temperature in units of 1012cm and MBH, 6 the mass of the black hole in units of 106 M⊙, to fix RP. Using a variety of methods we estimate MBH for 2MASX 1404-25 to be 4 ± 2 × 10⁶ M⊙ (see appendix B). From this we get RP, 12 = 0.82 ± 0.41. Fits were conducted, using these values of RP and are given in Table C.1.
5.2. Bolometric light curve
The X-ray light curve does not run parallel with the bolometric light curve and X-ray decay rates can be exaggerated by the disc temperature declining as the luminosity falls. In fact the discrepancy becomes exponential as the temperature drops below that of the observed X-ray energy range (see figures 14 and 15 of Mummery et al. 2023). The work of Mummery et al. (2023) considered the correction (ηX) needed to convert between thermal X-ray and bolometric luminosity. This varies slowly for kT ≥ 50 eV but rises exponentially as the temperature decreases. In section 5.1 we show that the spectrum of XMMSL2 J1404-2511 becomes modified by Compton upscattering of disc photons. This will temper the dramatic variation of ηX as the luminosity and hence temperature of seed photons drops, due to lower energy photons being shifted into the X-ray band. As an example of this effect, in Fig. 8 we show ηX vs TX for the Comptonisation model COMPBB, with electron temperature kTe = 2 keV and optical depth fixed at τ = 2 or kTe = 5 keV and τ = 1 (values which are permitted by the spectral fits of section 5.1).
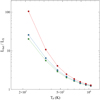 |
Fig. 8. Bolometric correction factor for 0.2–2 keV emission from a single temperature thermal spectrum (red) and a Comptonised thermal spectrum with electrons of temperature 2 keV and τ = 2 (blue) and 5 keV with τ = 1 (green), plotted against the peak temperature of the thermal component. |
We can estimate Lbol using fits of the Comptonised thermal disc spectrum (Table C.1) to the X ray spectra. In bolometric light, the steep decay of the X-ray light curve starting from day 100, flattens to a decay index of t−4.6 ± 0.3 (Fig. 9).
From the XMM-Newton slew observation, the peak luminosity was  ergs s−1 and applying the correction factor appropriate for a thermal model of kT = 92 eV (1 × 10⁶ K),
  ergs s−1. The total luminosity integrated over the bolometric light curve is 5 × 1050 ergs, equivalent to an accreted mass of ∼0.003 M⊙ during the 329 days of observations, for a mass to light conversion efficiency η = 0.1 (Gruzinov 1998). As the observations may have missed the peak of the emission this value is necessarily a lower limit.
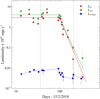 |
Fig. 9. X-ray (red circles), host-subtracted, absorption-corrected, UVOT-UVW2 filter (blue squares) and bolometric (green diamonds) luminosity light curves. Bolometric luminosities have been calculated from fits of a Comptonised thermal disc model to the X-ray spectra (see Section 5.1). Solid red line gives a fit of constant flux in the early phase and a decay of t−5.2 from day 100 to the X-ray luminosity. Dashed green line gives the same for the bolometric luminosity with a decay of t−4.6. Grey vertical dashed lines indicate the times of the radio non-detections. |
5.3. NuSTAR observation
To help determine whether the steep flux decay starting around day 100 was intrinsic or could have been caused by local absorption, a 69 ks observation was made with NuSTAR (Harrison et al. 2013) under ObsID 90401640002 simultaneously with the second XMM-Newton pointed observation. The NuSTAR data were reduced by using the standard NuSTARDAS software v1.8.0 and CALDB 20170727. We used a circular extraction region with a radius of 25″ centred on the coordinates of XMMSL2 J1404-2511 to extract any source counts. Background counts were extracted from a source free region in the same quadrant, using a circular region with a radius of 100″. We used the same regions for both telescopes, FPMA and FPMB. The source was barely detected in the XMM-Newton soft (0.2–2 keV) band and was not detected at all with NuSTAR with an upper limit of 2.4 × 10⁻³c/s from the combined FPMA and FPMB data in the 3–20 keV band, equating to a 2-σ upper limit of FX < 4.8 × 10⁻¹⁴ergs s−1 cm−2 in that band3 (Fig. 10). Using the combined XMM-Newton and NuSTAR spectrum, we can set constraints on the level of absorption which would be needed to explain the drop in flux purely by intrinsic absorption in the vicinity of the source. If we fit that combined spectrum with the spectral parameters from the first XMM-Newton pointed observation, then to get a good fit we would need to add a combination of a neutral absorber with  cm−2 and an ionised absorber (ZXIPCF; Reeves et al. 2008) with
  cm−2 and ionisation parameter
  both at the redshift of the source, yielding Cr = 122/133. A single absorber does not provide a good fit to the data.
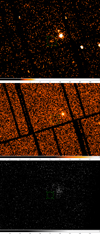 |
Fig. 10. Upper: EPIC-pn, 0.2–2 keV image of XMMSL2 J1404-2511 taken on 2019-01-10, Middle: Epic-pn, 2–10 keV image, Lower: NuSTAR, FPA, 3–100 keV image centred on the position of XMMSL2 J1404-2511. The source, whose position is denoted by a green circle, is not detected in the latter two images. |
5.4. eROSITA and late-time Swift observations
The position of XMMSL2 J1404-2511 was observed during five eROSITA (Predehl et al. 2021) all-sky surveys (eRASS) between 2020 and 2022. The eROSITA data were calibrated and cleaned using the pipeline version 020 of the eROSITA Science Analysis Software (eSASS, Brunner et al. 2022). For each eRASS, we merged all photon events from the seven telescopes into one event list file. The X-ray spectra and light curves for each eRASS were extracted using the SRCTOOL in eSASS (version 20211004). A circular region with a radius of 40″ was chosen as the source region for all eRASSs. While a source-free annular region with an inner radius of 100″ and an outer radius of 250″ was selected as the background region.
XMMSL2 J1404-2511 was detected by eROSITA in eRASS1, 2, and 5 (Table 2) at fluxes above the low state of 2019-01-10. The full light curve is shown in Fig. 11, and although the monitoring is very sparse, the data are consistent with three roughly equally spaced flares. This is very similar to the long-term light curve of eRASSt J045650.3-203750, which showed multiple flares interpreted as repeated partial disruptions of a stellar object (Liu et al. 2023, 2024). A suggested three-disruption light curve, consisting of a 50-day rise, a 100-day plateau and a 200-day decay, repeating every 710 days, has been overlaid on the figure. In this scenario, the non-detections from Swift on days 1994 and 2305 were either unfortunately placed and just missed the fourth flare, or the star has now been totally destroyed. Future X-ray observations around February 2026 should be able to confirm this.
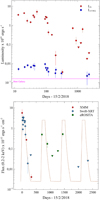 |
Fig. 11. Upper: X-ray (red circles) and host-subtracted, Galactic absorption-corrected, UVOT-UVW2 filter (blue squares) luminosity light curves. The modelled host galaxy UVW2 luminosity is shown for reference (pink dashed line), Lower: Full X-ray observed flux light curve calculated using the COMPBB model (see Table 3). The dotted line represents a flare consisting of a 50 day rise to a 100 day plateau of 2.5 × 10⁻¹² ergs s−1 cm−2 and a 200 day decay with index t−5, repeating every 710 days. Downward triangles denote 2-sigma upper limits. |
6. Discussion
From the lack of broad and narrow emission lines in the optical spectrum, the initially purely thermal X-ray spectrum and the very low luminosity of the second XMM-Newton pointed observation, we strongly disfavour AGN activity. The Wise colours, W1 = 13.476 mag (Vega), W2 = 13.445 mag (Vega), also support the classification of 2MASX 14044671-2511433 as a non-active galaxy (Stern et al. 2012). Therefore, we ascribe the observations of XMMSL2 J1404-2511 to a new accretion event, i.e. a TDE. The optical/UV characteristics of XMMSL2 J1404-2511 are similar to many other TDEs, given the rather poor monitoring data that we have, i.e. a standard temperature of a few ×104 K and a slow decay. However, the long-term ASAS-SN light curve does not show an optical peak at any stage (Fig. 4), which is unusual for a TDE4. Point to point variations in the V-band light curve yield an upper limit of 3 × 1042ergs s−1 for any possible optical peak prior to the X-ray discovery. Optical emission from XMMSL2 J1404-2511 is most easily understood as emission from the outer regions of the accretion disc (e.g. Mummery & Balbus 2020; Mummery & van Velzen 2025; Guolo & Mummery 2025).
We can then attempt to interpret the observations in terms of a TDE model capable of addressing the distinctive X-ray characteristics of XMMSL2 J1404-2511: 1. A plateau of at least 100 days. 2. The development of a harder component on a timescale of ∼10 days. 3. A steep decay of the X-ray flare by a factor ∼500 over ∼200 days after the end of the plateau. 4. Repeated flares in later data.
6.1. X-ray light-curve plateau
The first TDEs discovered by ROSAT showed sharp decays in their light curves interpreted as a response to a reduction in the rate of returning debris (Komossa 2004, and references therein). As can be seen from Fig. 9, the X-ray flux, and the inferred bolometric flux in XMMSL2 J1404-2511 vary little over the first 100 days of observations. We interpret this as a plateau similar to that seen in several sources such as XMMSL2 J144605.0+685735 (Saxton et al. 2019) and ASSASN-15oi (Gezari et al. 2017). The lack of previous X-ray observations prevent us from knowing the full duration of the plateau5. There are two main reasons why the light curve might decay more slowly than the rate of incoming material. When the fall back rate is super-Eddington, a combination of energy advected into the black hole (photon trapping) (Abramowicz et al. 1988; Ohsuga et al. 2002), increasing colour-correction factor (Wen et al. 2020) and loss of material in high-speed winds (e.g. Dai et al. 2018) leads to a self-limiting emitted X-ray luminosity, which has been used to explain the flat light curve of 3XMM J150052.0+015452 (Lin et al. 2017; Cao et al. 2023). The fact that an accretion disc state change (i.e. development of a hard component), which is expected to happen at sub-Eddington accretion rates (Esin et al. 1997; Maccarone 2003, and see Section 6.3), occurred in XMMSL2 J1404-2511 during the plateau phase argues against a sustained period of super-Eddington accretion during the plateau in this case.
A more likely explanation is that debris spreads out into an accretion disc which accretes viscously (Cannizzo et al. 1990; Mummery & Balbus 2020; Jonker et al. 2020). If this happens, then the disc can act as a reservoir of accretable material until the rate of incoming debris falls below the rate of material being consumed centrally, in which case the luminosity will drop again.
The UV/optical luminosity during the plateau is lower than seen in many TDEs, with a mean plateau luminosity in the UVOT-U filter of LU ∼ 5 × 1040 ergs s−1. From the relationship between optical plateau luminosity and black hole mass derived in Mummery et al. (2024) we obtain a mass of  . This is lower than our other estimates (Appendix B), but we note that the scatter of the Mummery et al. (2024) relationship is particularly large at the low mass end, while being constrained at the other end by the Hills mass.
6.2. What triggers the development of the corona and when does it happen?
At the time of the development of the Comptonisation zone the observed temperature of the disc emission was kT ∼ 80 eV. If we take 2018-03-07 as the date when the zone formed, then from Table C.1, the bolometric luminosity was Lbol = 7 ± 3 × 1043 ergs s−1 and the Eddington ratio  for the adopted mass of MBH = 4 ± 2 × 10⁶ M⊙. From Mummery et al. (2023) we see that disc orientation can increase the bolometric correction, and hence implied accretion rate, at this temperature by up to a factor 4 due to the X-ray emitting region being obscured by the outer disc. The absence of intrinsic absorption in the X-ray spectrum makes it unlikely that we are seeing the emission at very high inclination angles so this effect is likely to be moderate; this argument could be made yet more strongly for AT2021ehb by Yao et al. (2022) where the disc was thicker.
State transitions are commonly seen in accreting Galactic black hole binaries (Belloni et al. 1997; Remillard & McClintock 2006). Changes on timescales of days or longer in these systems have been attributed to disc instabilities (e.g. Dubus et al. 2001; Kalemci et al. 2013), which when scaled up to the size of an SMBH are far longer than those seen here. However, in specific binaries that show signs of obscuration and are accreting near the Eddington limit (such as GRS 1915+105, V4641 Sgr, V404 Cyg), analogous spectral transitions can occur within about 10 seconds (Rao et al. 2000; Maitra & Bailyn 2006; Kajava et al. 2020). If scaled linearly from a 10 M⊙ to a 106 M⊙ SMBH, these rapid viscous time-scale spectral transitions would imply a state change of 106 seconds (∼10 days), totally consistent with that seen in XMMSL2 J1404-2511. Destruction and construction of an X-ray corona, possibly associated with a tidal disruption event, has also been seen to occur on a timescale of 10s to 100 days in a CLAGN (Ricci et al. 2020; Li et al. 2024). Finally it is interesting to compare this event with the still faster quasi-periodic eruptions (QPEs; Miniutti et al. 2019; Giustini et al. 2020; Arcodia et al. 2021) seen in other TDE systems. The spectral change in XMMSL2 J1404-2511 is superficially similar to that seen in e.g. GSN 069, where the effective temperature of the emission increased from 50 eV to 120 eV. In GSN 069 this change occurs in 2000-3000 seconds (Miniutti et al. 2019), several hundred times faster than in XMMSL2 J1404-2511. From Fig. 7 it takes 12 days to increase the effective temperature to 120 eV. Even considering the lightest possible black hole in GSN 069 allowed by the M − σ relation of 3.2 × 10⁵ M⊙ (Wevers et al. 2022), scaling down linearly would still need ∼1 day for the change, a factor 50 slower than the QPEs. Hence it seems unlikely that the same mechanism is responsible for the spectral changes seen in both XMMSL2 J1404-2511 and QPEs.
When the corona in XMMSL2 J1404-2511 begins to form, there is a coincident drop and recovery in flux (Fig. 12) equivalent to a loss in total bolometric luminosity of ∼1049 ergs or accretion energy of ∼1050 ergs, assuming a mass to light conversion factor of 0.1. If the two are related, then this may suggest that accretion energy is temporarily redirected into the creation of the warm corona, e.g. by magnetically heating the outer skin of the disc (Gronkiewicz & Różańska 2020), or into increasing its optical depth. Our observations show a timescale for the creation of the warm corona around a MBH ∼ 106 M⊙ black hole of ∼10 days which models will need to comply with. Similar model constraints for a transition in the opposite direction are provided by the destruction, or at least significant reduction, of the hot corona in ∼3 days in AT2021ehb (Yao et al. 2022).
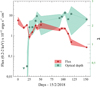 |
Fig. 12. Optical depth and observed 0.2–2 keV flux for the first 152 days of observations of XMMSL2 J1404-2511 using a spectral model of COMPBB with kTe = 5 keV. The shaded areas represent 90% confidence intervals on the measured parameters. |
6.3. Why is corona creation in TDEs not ubiquitous?
Guolo et al. (2024) looked at X-ray data from optically discovered TDEs, finding that at least 40% had X-ray emission and showing that the perceived preponderance of optical TDEs (Gezari 2021; Hammerstein et al. 2023) is strongly biased by the current superiority of optical surveys in identifying TDEs. Only 3 of the 17 optically selected, X-ray detected TDEs were seen to develop a hard X-ray corona. Conversely, from a literature search we find that 10 of the 12 TDEs and candidate TDEs discovered in the XMM-Newton slew survey had or subsequently developed a significant hard component on top of the thermal disc emission in at least one observation6 (Table 4). A Monte Carlo simulation ran 100 000 times gives a probability of 0.04% that the XMM slew and optically selected sets are drawn from the same population. If we remove from the slew sample the TDEs which showed evidence of a possible pre-existing AGN, then the ratio becomes 6 out of 7 and the probability 0.14%. On the face of it, this suggests that there is an intrinsic difference between optically and X-ray identified TDEs and that observed differences are not purely due to viewing angle (Dai et al. 2018; Gezari 2021). However, as pointed out in Guolo et al. (2024) and evident from Fig. 8, TDEs which develop a hard component become more luminous in X-rays, making them more likely to be detected in time-limited X-ray surveys such as the XMM-Newton slew survey7. More importantly, monitoring campaigns of events need to extend into epochs when the hard component becomes detectable. We note that two of the thermal TDEs from the Guolo et al. (2024) sample, AT2019teq (Yao & Guolo 2022; Ajay et al. 2022) and ASASSN-15oi (Hajela et al. 2025) have recently developed a hard X-ray corona. Further monitoring of the optical sample is therefore needed to confirm whether the apparent discrepancy in coronal properties is real.
TDEs discovered in the XMM-Newton slew survey.
Wevers (2020) proposed that the transition to a harder state occurs in TDEs when the accretion rate drops below a value of fedd ∼ 10−2 − 10−1Ledd, finding that TDEs in the X-ray thermal state were more luminous than those displaying coronal emission (“Fainter harder brighter softer”). AT2021ehb and AT2020ocn, however, failed to show a simple connection between the accretion rate and X-ray hardness ratio (Guolo et al. 2024). In XMMSL2 J1404-2511 we find that the state change appears at fedd ∼ 0.1Ledd.
We will consider three separate components while discussing the observed spectra: a thermal component from the disc, a hot, optically thin electron corona indicated by a power-law component with a slope less than 2.5 and a warm, optically thick, electron corona, indicated by a power-law with a slope of 2.5 or more. Compton upscattering of photons from a warm corona, consisting of an electron population with kTe ∼ 0.1 − 1 keV and optical depth > 1 has been argued to be responsible for the characteristic shape of the X-ray soft-excess in many AGNs (Magdziarz et al. 1998; Done et al. 2012; Petrucci et al. 2018; Ballantyne et al. 2024; Palit et al. 2024). It is envisaged as either an extra optically thick layer on top of the standard accretion disc (Janiuk et al. 2001; Gronkiewicz et al. 2023) or a radial structure separated from the disc (Done et al. 2012; Kubota & Done 2018). In AGNs the slope of the hot coronal power law is almost always below 2.5 (Ballantyne et al. 2024) except in narrow-line Seyfert 1 galaxies when they are accreting at very high rates (Ojha et al. 2020; Grünwald et al. 2023). We take the hot and warm coronae to be separate physical components as justified for example by time delays seen between energy bands (e.g. Gallo et al. 2004). Indeed, Liu et al. (2023) recover both a hard power-law and a soft-excess component in the repeating partial TDE, eRASSt J045650.3-203750.
Warm coronae in AGNs are found with electron temperatures between 0.1 and 1 keV (Petrucci et al. 2018) and optical depths of 10–20 (Petrucci et al. 2018; Ballantyne et al. 2024). In XMMSL2 J1404-2511 we find  keV and τ ∼ 3. Similar values were found in observations of the TDEs AT2020ocn (
 ; Cao et al. 2024) and 3XMM J150052.0+015452 (
 ; Cao et al. 2023), although in other observations of AT2020ocn (Cao et al. 2024) and in eRASSt J045650.3-203750 (Liu et al. 2023) electron temperatures < 1 keV, more typical of AGNs, were seen.
Some events show both thermal X-ray and warm corona emission, e.g. eRASSt J045650.3-203750 (Liu et al. 2023) and AT2020ocn (Cao et al. 2024), who find that some spectra can be best fit with a patchy (i.e. covering factor < 1 corona). The lack of visible thermal emission in persistent AGNs suggests that the covering factor is always 1 there, although we note that this can not be proven for AGNs with higher mass black holes and hence cooler discs whose thermal emission does not reach the X-ray band. The only AGNs which do show thermal X-ray emission are those which are believed to have experienced a recent TDE, e.g. 1ES 1927+654 (Ricci et al. 2020). In summary, in some observations of TDEs the warm corona appears to be hotter, less optically thick and with a lower covering factor than the standard AGN soft excess.
The observed softening at late time of AT2021ehb and AT2018fyk (Yao et al. 2022; Wevers et al. 2023) can be explained by the reduction/disappearance of the hard power-law leaving the steeper-sloped soft excess dominant but not that the source has returned to the thermal state. Wevers et al. (2021) attribute the late-time softening of AT2018fyk to a transition into the quiescent state, which has parallels in X-ray binaries (Plotkin et al. 2013) and CLAGN (Ruan et al. 2019).
6.4. Decay rate of the luminosity
At the end of the plateau phase, XMMSL2 J1404-2511 dropped in X-ray (bolometric) luminosity by a factor 500 (100) in 230 days, equivalent to a decay index of t−5.2(−4.6). This is much steeper than the canonical return of tidal debris (t−5/3) (Rees 1988). It is also well in excess of the steeper decline of t−9/4 predicted from pTDEs where the stellar core survives (Coughlin & Nixon 2019; Nixon et al. 2021), although simulations show that a pTDE from a weak encounter can produce a decline in returning material with index up to 5 (Ryu et al. 2020).
Similar steep decays were seen in AT2018fyk (Wevers et al. 2021) whose X-ray luminosity fell by a factor 5000 in 170 days, eRASSt J045650.3-203750 with a factor 100 decay in a week (Liu et al. 2023), and RX J133157.6-324319.7 which exhibited a > 40-fold decrease in 17 days (Malyali et al. 2023); all of these are repeating pTDEs (Wevers et al. 2023; Liu et al. 2023; Malyali et al. 2023). The implication is that the rapid drop to the quiescent state may have been caused by a deficit of available material in a small disc which was quickly consumed.
An even more abrupt decay in SWIFT J164449.3+573451 has been attributed to the turn-off of a relativistic jet due to the accretion rate falling below Eddington (Zauderer et al. 2013). The deep limits we present here on radio emission from XMMSL2 J1404-2511 (section 4) and the fact that the transition happened at an accretion rate well below Eddington make it unlikely that this is the responsible mechanism here.
The ultra-fast decline in the luminosity cycles of eRASSt J045650.3-203750 may have been augmented by a change of accretion disc state (Liu et al. 2023). Other sharp declines in AT2019avd (Wang et al. 2024), which fell by a factor ∼100 in ∼50 days while the X-ray spectrum hardened, and in AT2021ehb, which dropped by a factor 10 in flux over 3 days accompanied by a softening of the X-ray spectrum, reinforce the idea of a transition to a less radiatively efficient disc state accelerating the decline.
The discovery of more flaring activity by eROSITA (Fig. 11) leads to a viable interpretation for the rapid decay in the light curve of XMMSL2 J1404-2511, during 2018 and 2019, as being due to a partial disruption transferring a small quantity of material into an accretion disc. The fall in luminosity perhaps being accelerated by the disc transiting into a less radiatively efficient state (Shen & Matzner 2014), when the accretion rate fell below a few per cent of Eddington.
We note that an alternative explanation for the repeated flares could be given by thermal instabilities in a disc fed by a single disruption event (Shen & Matzner 2014; Saxton et al. 2015; Piro & Mockler 2025). Models suggest that these can occur on timescales of months to a few years (Shen & Matzner 2014; Piro & Mockler 2025; Linial & Metzger 2024), compatible with the light curves seen in pTDEs to date.
In summary, the XMMSL2 J1404-2511 data are consistent with a TDE discovered in the plateau phase, with X-ray and UV emission dominated by thermal emission from the disc. The conditions in the accretion structure were such that a corona quickly formed but faded away between days 100 and 300. The rapid decay of the X-ray flux in this event indicates a relatively small total amount of accreted mass and the repeat flares seen in the eROSITA data make it probable that the event consists of a series of repeated partial tidal disruptions. We note that we were fortunate to have the eROSITA survey to confirm the secondary flares which would otherwise have gone unnoticed. To avoid this in future, any TDE which shows an unusually rapid decay should be followed sporadically for several years after the event to check for repeat flares.
7. Conclusions
We identify the XMM-Newton slew transient, XMMSL2 J1404-2511, as a TDE which showed an unusually rapid flux and spectral evolution. The X-ray spectrum evolved from a low-temperature (kT ∼ 80 eV) purely thermal spectrum to having a significant hard component within < 5 − 12 days, putting the strongest constraint to date on this disc state transition. After a plateau period of ∼100 days, the X-ray luminosity decayed by a factor 500 over the following 230 days. We note that other sources with a similarly rapid decay also displayed evidence of a powerful corona, and suggest that the accelerated evolution of these events is due to a partial tidal disruption, leading to a rapid decrease in available fuel and passage through different accretion disc states. Observations during the eROSITA survey detected a resurgence of activity in XMMSL2 J1404-2511 commensurate with flares repeating with a period of ∼710 days and lending support to the idea that XMMSL2 J1404-2511 has experienced multiple partial tidal disruptions. We recommend that any future TDE which shows an unusually rapid decay should continue to be monitored to check for repeat flares.
We find that a significantly higher fraction of TDEs with a hard X-ray component are found in an X-ray discovered sample than in an optically selected sample, pointing towards a possible intrinsic difference in their properties. To exclude selection bias further monitoring of the optical sample is needed.
Data Availability
The data and scripts used in this paper are available on Zenodo (https://doi.org/10.5281/zenodo.14601857).
Using an alternative scaling relation (Greene et al. 2020) gives a consistent mass of log10(MBH) = 6.80 ± 0.55 M⊙.
Calculated using a source circle of radius 29″(containing 50% of the counts; Harrison et al. 2013), a local background and a spectrum of a power-law of Γ = 3.4 absorbed by the Galactic column.
Although an increasing number of X-ray discovered TDEs are being found with no simultaneous or preceding optical transient (Sazonov et al. 2021; Jin et al. 2025).
We note that had the Einstein Probe (Yuan et al. 2016) been in nominal operations prior to 2018, the question of previous behaviour would have been resolved, illustrating what a great asset that mission will be to TDE astronomy.
Curiously the two XMM-Newton slew TDE which are purely or mainly thermal are the only ones which exhibit QPEs (Miniutti et al. 2019; Chakraborty et al. 2021). This may be related to the fact that QPEs, by their nature, are more easily detected as enhancements on top of very soft X-ray spectra but it does open the possibility that the mechanism responsible for QPEs is present in many TDEs.
Note that this will also be true for the eROSITA survey (Sazonov et al. 2021) and to some extent, flux-limited surveys like the Einstein Probe (Yuan et al. 2016).
Acknowledgments
We thank the anonymous referee for constructive comments which improved the manuscript. We would like to thank the XMM OTAC for approving this program. The XMM-Newton project is an ESA science mission with instruments and contributions directly funded by ESA member states and the USA (NASA). The XMM-Newton project is supported by the Bundesministerium für Wirtschaft und Technologie/Deutches Zentrum für Luft- und Raumfahrt (BMWI/DLR, FKZ 50 OX 0001), the Max-Planck Society and the Heidenhain-Stiftung. We thank the Swift team for approving and performing the monitoring observations. This work made use of data supplied by the UK Swift Science Data Centre at the University of Leicester. We thank the NuSTAR project scientist for allocating DDT time to this project. This research has made use of the NuSTAR Data Analysis Software (NuSTARDAS) jointly developed by the ASI Science Data Center (ASDC, Italy) and the California Institute of Technology (USA). This publication makes use of VOSA, developed under the Spanish Virtual Observatory (https://svo.cab.inta-csic.es) project funded by MCIN/AEI/10.13039/501100011033/ through grant PID2020-112949GB-I00. VOSA has been partially updated by using funding from the European Union’s Horizon 2020 Research and Innovation Programme, under Grant Agreement n°776403 (EXOPLANETS-A). Some of the data presented in this paper were obtained from the Mikulski Archive for Space Telescopes (MAST). STScI is operated by the Association of Universities for Research in Astronomy, Inc., under NASA contract NAS5-26555. RS would like to thank the late Tomaso Belloni for conversations along the years which helped to form some of the ideas in this paper. This work is based on data from eROSITA, the soft X-ray instrument aboard SRG, a joint Russian-German science mission supported by the Russian Space Agency (Roskosmos), in the interests of the Russian Academy of Sciences represented by its Space Research Institute (IKI), and the Deutsches Zentrum für Luft- und Raumfahrt (DLR). The SRG spacecraft was built by Lavochkin Association (NPOL) and its subcontractors, and is operated by NPOL with support from the Max Planck Institute for Extraterrestrial Physics (MPE). The development and construction of the eROSITA X-ray instrument was led by MPE, with contributions from the Dr. Karl Remeis Observatory Bamberg & ECAP (FAU Erlangen-Nuernberg), the University of Hamburg Observatory, the Leibniz Institute for Astrophysics Potsdam (AIP), and the Institute for Astronomy and Astrophysics of the University of Tübingen, with the support of DLR and the Max Planck Society. The Argelander Institute for Astronomy of the University of Bonn and the Ludwig Maximilians Universität Munich also participated in the science preparation for eROSITA. Some plots in this paper were produced using the Veusz software package (http://veusz.github.io/). GM acknowledges support from grants n. PID2020-115325GB-C31 and n. PID2023-147338NB-C21 funded by MICIU/AEI/10.13039/50110001103. MG is funded by Spanish MICIU/AEI/10.13039/501100011033 and ERDF/EU grant PID2023-147338NB-C21. KA acknowledges support provided by the National Science Foundation through award AST-2307668 and from the Alfred P. Sloan Foundation.
References
- Abramowicz, M. A., Czerny, B., Lasota, J. P., & Szuszkiewicz, E. 1988, ApJ, 332, 646 [Google Scholar]
- Ajay, Y., Pasham, D., & Guolo, M. 2022, ATel., 15724, 1 [Google Scholar]
- Akylas, A., & Georgantopoulos, I. 2021, A&A, 655, A60 [NASA ADS] [CrossRef] [EDP Sciences] [Google Scholar]
- Alexander, K. D., van Velzen, S., Horesh, A., & Zauderer, B. A. 2020, Space Sci. Rev., 216, 81 [CrossRef] [Google Scholar]
- Arcavi, I., Gal-Yam, A., Sullivan, M., et al. 2014, ApJ, 793, 38 [Google Scholar]
- Arcodia, R., Merloni, A., Nandra, K., et al. 2021, Nature, 592, 704 [NASA ADS] [CrossRef] [Google Scholar]
- Arnaud, K. A. 1996, ASP Conf. Ser., 101, 17 [Google Scholar]
- Auchettl, K., Guillochon, J., & Ramirez-Ruiz, E. 2017, ApJ, 838, 149 [Google Scholar]
- Ballantyne, D. R., Sudhakar, V., Fairfax, D., et al. 2024, MNRAS, 530, 1603 [NASA ADS] [CrossRef] [Google Scholar]
- Belloni, T., Méndez, M., King, A. R., van der Klis, M., & van Paradijs, J. 1997, ApJ, 479, L145 [NASA ADS] [CrossRef] [Google Scholar]
- Bianchi, L., Shiao, B., & Thilker, D. 2017, ApJS, 230, 24 [Google Scholar]
- Bloom, J. S., Giannios, D., Metzger, B. D., et al. 2011, Science, 333, 203 [CrossRef] [PubMed] [Google Scholar]
- Bright, J. S., Fender, R. P., Motta, S. E., et al. 2018, MNRAS, 475, 4011 [Google Scholar]
- Brown, J. S., Holoien, T. W. S., Auchettl, K., et al. 2017, MNRAS, 466, 4904 [Google Scholar]
- Brunner, H., Liu, T., Lamer, G., et al. 2022, A&A, 661, A1 [NASA ADS] [CrossRef] [EDP Sciences] [Google Scholar]
- Burrows, D. N., Kennea, J. A., Ghisellini, G., et al. 2011, Nature, 476, 421 [NASA ADS] [CrossRef] [Google Scholar]
- Cannizzo, J. K., Lee, H. M., & Goodman, J. 1990, ApJ, 351, 38 [NASA ADS] [CrossRef] [Google Scholar]
- Cao, Z., Jonker, P. G., Wen, S., Stone, N. C., & Zabludoff, A. I. 2023, MNRAS, 519, 2375 [Google Scholar]
- Cao, Z., Jonker, P. G., Pasham, D. R., et al. 2024, ApJ, 970, 89 [NASA ADS] [CrossRef] [Google Scholar]
- Cappellari, M. 2017, MNRAS, 466, 798 [Google Scholar]
- Chakraborty, J., Kara, E., Masterson, M., et al. 2021, ApJ, 921, L40 [NASA ADS] [CrossRef] [Google Scholar]
- Christy, C. T., Alexander, K. D., Margutti, R., et al. 2024, ApJ, 974, 18 [Google Scholar]
- Conroy, C., Gunn, J. E., & White, M. 2009, ApJ, 699, 486 [Google Scholar]
- Coughlin, E. R., & Nixon, C. J. 2019, ApJ, 883, L17 [NASA ADS] [CrossRef] [Google Scholar]
- Dai, L., McKinney, J. C., Roth, N., Ramirez-Ruiz, E., & Miller, M. C. 2018, ApJ, 859, L20 [Google Scholar]
- Dey, A., Schlegel, D. J., Lang, D., et al. 2019, AJ, 157, 168 [Google Scholar]
- Done, C., Mulchaey, J. S., Mushotzky, R. F., & Arnaud, K. A. 1992, ApJ, 395, 275 [NASA ADS] [CrossRef] [Google Scholar]
- Done, C., Davis, S. W., Jin, C., Blaes, O., & Ward, M. 2012, MNRAS, 420, 1848 [Google Scholar]
- Dubus, G., Hameury, J. M., & Lasota, J. P. 2001, A&A, 373, 251 [NASA ADS] [CrossRef] [EDP Sciences] [Google Scholar]
- Esin, A. A., McClintock, J. E., & Narayan, R. 1997, ApJ, 489, 865 [NASA ADS] [CrossRef] [Google Scholar]
- Esquej, P., Saxton, R. D., Komossa, S., et al. 2008, A&A, 489, 543 [NASA ADS] [CrossRef] [EDP Sciences] [Google Scholar]
- Evans, P. A., Beardmore, A. P., Page, K. L., et al. 2009, MNRAS, 397, 1177 [Google Scholar]
- Gabriel, C., Denby, M., Fyfe, D. J., et al. 2004, ASP Conf. Ser., 314, 759 [Google Scholar]
- Gallo, L. C., Boller, T., Tanaka, Y., et al. 2004, MNRAS, 347, 269 [Google Scholar]
- Gehrels, N., Chincarini, G., Giommi, P., et al. 2004, ApJ, 611, 1005 [Google Scholar]
- Gezari, S. 2021, ARA&A, 59, 21 [NASA ADS] [CrossRef] [Google Scholar]
- Gezari, S., Halpern, J. P., Komossa, S., Grupe, D., & Leighly, K. M. 2003, ApJ, 592, 42 [Google Scholar]
- Gezari, S., Cenko, S. B., & Arcavi, I. 2017, ApJ, 851, L47 [NASA ADS] [CrossRef] [Google Scholar]
- Giustini, M., Miniutti, G., & Saxton, R. D. 2020, A&A, 636, L2 [NASA ADS] [CrossRef] [EDP Sciences] [Google Scholar]
- Greene, J. E., Strader, J., & Ho, L. C. 2020, ARA&A, 58, 257 [Google Scholar]
- Gronkiewicz, D., & Różańska, A. 2020, A&A, 633, A35 [NASA ADS] [CrossRef] [EDP Sciences] [Google Scholar]
- Gronkiewicz, D., Różańska, A., Petrucci, P.-O., & Belmont, R. 2023, A&A, 675, A198 [NASA ADS] [CrossRef] [EDP Sciences] [Google Scholar]
- Grünwald, G., Boller, T., Rakshit, S., et al. 2023, A&A, 669, A37 [NASA ADS] [CrossRef] [EDP Sciences] [Google Scholar]
- Gruzinov, A. V. 1998, ApJ, 501, 787 [NASA ADS] [CrossRef] [Google Scholar]
- Guillochon, J., & Ramirez-Ruiz, E. 2013, ApJ, 767, 25 [NASA ADS] [CrossRef] [Google Scholar]
- Gültekin, K., Richstone, D. O., Gebhardt, K., et al. 2009, ApJ, 698, 198 [Google Scholar]
- Guolo, M., & Mummery, A. 2025, ApJ, 978, 167 [Google Scholar]
- Guolo, M., Gezari, S., Yao, Y., et al. 2024, ApJ, 966, 160 [NASA ADS] [CrossRef] [Google Scholar]
- Hajela, A., Alexander, K. D., Margutti, R., et al. 2025, ApJ, 983, 29 [Google Scholar]
- Hammerstein, E., van Velzen, S., Gezari, S., et al. 2023, ApJ, 942, 9 [NASA ADS] [CrossRef] [Google Scholar]
- Harrison, F. A., Craig, W. W., Christensen, F. E., et al. 2013, ApJ, 770, 103 [Google Scholar]
- Hart, K., Shappee, B. J., Hey, D., et al. 2023, ArXiv e-prints [arXiv:2304.03791] [Google Scholar]
- Hills, J. G. 1975, Nature, 254, 295 [Google Scholar]
- Hodgkin, S. T., Harrison, D. L., Breedt, E., et al. 2021, A&A, 652, A76 [NASA ADS] [CrossRef] [EDP Sciences] [Google Scholar]
- Holoien, T. W. S., Prieto, J. L., Bersier, D., et al. 2014, MNRAS, 445, 3263 [NASA ADS] [CrossRef] [Google Scholar]
- Holoien, T. W. S., Kochanek, C. S., Prieto, J. L., et al. 2016, MNRAS, 455, 2918 [NASA ADS] [CrossRef] [Google Scholar]
- Janiuk, A., Czerny, B., & Madejski, G. M. 2001, ApJ, 557, 408 [NASA ADS] [CrossRef] [Google Scholar]
- Jansen, F., Lumb, D., Altieri, B., et al. 2001, A&A, 365, L1 [NASA ADS] [CrossRef] [EDP Sciences] [Google Scholar]
- Jiang, N., Dou, L., Wang, T., et al. 2016, ApJ, 828, L14 [Google Scholar]
- Jin, C. C., Li, D. Y., Jiang, N., et al. 2025, ArXiv e-prints [arXiv:2501.09580] [Google Scholar]
- Johnson, B., & Leja, J. 2017, https://doi.org/10.5281/zenodo.1116491 [Google Scholar]
- Jonker, P. G., Stone, N. C., Generozov, A., van Velzen, S., & Metzger, B. 2020, ApJ, 889, 166 [NASA ADS] [CrossRef] [Google Scholar]
- Kajava, J. J. E., Sánchez-Fernández, C., Alfonso-Garzón, J., Motta, S. E., & Veledina, A. 2020, A&A, 634, A94 [NASA ADS] [CrossRef] [EDP Sciences] [Google Scholar]
- Kalemci, E., Dinçer, T., Tomsick, J. A., et al. 2013, ApJ, 779, 95 [NASA ADS] [CrossRef] [Google Scholar]
- Komossa, S. 2004, IAU Symp., 222, 45 [Google Scholar]
- Komossa, S. 2015, J. High Energy Astrophys., 7, 148 [Google Scholar]
- Komossa, S., & Bade, N. 1999, A&A, 343, 775 [NASA ADS] [Google Scholar]
- Kubota, A., & Done, C. 2018, MNRAS, 480, 1247 [Google Scholar]
- Laha, S., Ricci, C., Mather, J. C., et al. 2025, Front. Astron. Space Sci., 11, 1530392 [Google Scholar]
- Li, D., Saxton, R. D., Yuan, W., et al. 2020, ApJ, 891, 121 [Google Scholar]
- Li, R., Ricci, C., Ho, L. C., et al. 2024, ApJ, 975, 140 [NASA ADS] [CrossRef] [Google Scholar]
- Lin, D., Guillochon, J., Komossa, S., et al. 2017, Nat. Astron., 1, 0033 [Google Scholar]
- Linial, I., & Metzger, B. D. 2024, ApJ, 973, 101 [Google Scholar]
- Liu, Z., Malyali, A., Krumpe, M., et al. 2023, A&A, 669, A75 [NASA ADS] [CrossRef] [EDP Sciences] [Google Scholar]
- Liu, Z., Ryu, T., Goodwin, A. J., et al. 2024, A&A, 683, L13 [NASA ADS] [CrossRef] [EDP Sciences] [Google Scholar]
- Maccarone, T. J. 2003, A&A, 409, 697 [NASA ADS] [CrossRef] [EDP Sciences] [Google Scholar]
- Magdziarz, P., & Zdziarski, A. A. 1995, MNRAS, 273, 837 [Google Scholar]
- Magdziarz, P., Blaes, O. M., Zdziarski, A. A., Johnson, W. N., & Smith, D. A. 1998, MNRAS, 301, 179 [NASA ADS] [CrossRef] [Google Scholar]
- Mainzer, A., Bauer, J., Grav, T., et al. 2011, ApJ, 731, 53 [Google Scholar]
- Maitra, D., & Bailyn, C. D. 2006, ApJ, 637, 992 [Google Scholar]
- Malyali, A., Liu, Z., Rau, A., et al. 2023, MNRAS, 520, 3549 [NASA ADS] [CrossRef] [Google Scholar]
- Marconi, A., & Hunt, L. K. 2003, ApJ, 589, L21 [Google Scholar]
- Martin, D. C., Fanson, J., Schiminovich, D., et al. 2005, ApJ, 619, L1 [Google Scholar]
- Miniutti, G., Saxton, R. D., Rodríguez-Pascual, P. M., et al. 2013, MNRAS, 433, 1764 [NASA ADS] [CrossRef] [Google Scholar]
- Miniutti, G., Saxton, R. D., Giustini, M., et al. 2019, Nature, 573, 381 [Google Scholar]
- Mou, G., Dou, L., Jiang, N., et al. 2021, ApJ, 908, 197 [Google Scholar]
- Mummery, A. 2021, MNRAS, 507, L24 [NASA ADS] [CrossRef] [Google Scholar]
- Mummery, A., & Balbus, S. A. 2020, MNRAS, 492, 5655 [NASA ADS] [CrossRef] [Google Scholar]
- Mummery, A., & van Velzen, S. 2025, MNRAS, 541, 429 [Google Scholar]
- Mummery, A., Wevers, T., Saxton, R., & Pasham, D. 2023, MNRAS, 519, 5828 [NASA ADS] [CrossRef] [Google Scholar]
- Mummery, A., van Velzen, S., Nathan, E., et al. 2024, MNRAS, 527, 2452 [Google Scholar]
- Nishimura, J., Mitsuda, K., & Itoh, M. 1986, PASJ, 38, 819 [NASA ADS] [Google Scholar]
- Nixon, C. J., Coughlin, E. R., & Miles, P. R. 2021, ApJ, 922, 168 [NASA ADS] [CrossRef] [Google Scholar]
- Ohsuga, K., Mineshige, S., Mori, M., & Umemura, M. 2002, ApJ, 574, 315 [NASA ADS] [CrossRef] [Google Scholar]
- Ojha, V., Chand, H., Dewangan, G. C., & Rakshit, S. 2020, ApJ, 896, 95 [NASA ADS] [CrossRef] [Google Scholar]
- Palit, B., Różańska, A., Petrucci, P. O., et al. 2024, A&A, 690, A308 [NASA ADS] [CrossRef] [EDP Sciences] [Google Scholar]
- Petrucci, P. O., Ursini, F., De Rosa, A., et al. 2018, A&A, 611, A59 [NASA ADS] [CrossRef] [EDP Sciences] [Google Scholar]
- Piran, T., Svirski, G., Krolik, J., Cheng, R. M., & Shiokawa, H. 2015, ApJ, 806, 164 [Google Scholar]
- Piro, A. L., & Mockler, B. 2025, ApJ, 985, 77 [Google Scholar]
- Plotkin, R. M., Gallo, E., & Jonker, P. G. 2013, ApJ, 773, 59 [NASA ADS] [CrossRef] [Google Scholar]
- Ponti, G., Papadakis, I., Bianchi, S., et al. 2012, A&A, 542, A83 [NASA ADS] [CrossRef] [EDP Sciences] [Google Scholar]
- Predehl, P., Andritschke, R., Arefiev, V., et al. 2021, A&A, 647, A1 [EDP Sciences] [Google Scholar]
- Prugniel, P., Soubiran, C., Koleva, M., & Le Borgne, D. 2007, ArXiv e-prints [arXiv:astro-ph/0703658] [Google Scholar]
- Rao, A. R., Yadav, J. S., & Paul, B. 2000, ApJ, 544, 443 [Google Scholar]
- Read, A. M., Saxton, R., Komossa, S., Alexander, K. D., & Maksym, W. P. 2018, ATel., 11394, 1 [Google Scholar]
- Rees, M. J. 1988, Nature, 333, 523 [Google Scholar]
- Rees, M. J. 1990, Science, 247, 817 [NASA ADS] [CrossRef] [Google Scholar]
- Reeves, J., Done, C., Pounds, K., et al. 2008, MNRAS, 385, L108 [Google Scholar]
- Remillard, R. A., & McClintock, J. E. 2006, ARA&A, 44, 49 [Google Scholar]
- Ricci, C., & Trakhtenbrot, B. 2023, Nat. Astron., 7, 1282 [Google Scholar]
- Ricci, C., Kara, E., Loewenstein, M., et al. 2020, ApJ, 898, L1 [Google Scholar]
- Ruan, J. J., Anderson, S. F., Eracleous, M., et al. 2019, ApJ, 883, 76 [NASA ADS] [CrossRef] [Google Scholar]
- Ryu, T., Krolik, J., Piran, T., & Noble, S. C. 2020, ApJ, 904, 100 [NASA ADS] [CrossRef] [Google Scholar]
- Saxton, R. D., Read, A. M., Esquej, P., et al. 2012, A&A, 541, A106 [NASA ADS] [CrossRef] [EDP Sciences] [Google Scholar]
- Saxton, R. D., Read, A. M., Komossa, S., et al. 2014, A&A, 572, A1 [NASA ADS] [CrossRef] [EDP Sciences] [Google Scholar]
- Saxton, R. D., Motta, S. E., Komossa, S., & Read, A. M. 2015, MNRAS, 454, 2798 [NASA ADS] [CrossRef] [Google Scholar]
- Saxton, R. D., Read, A. M., Komossa, S., et al. 2017, A&A, 598, A29 [NASA ADS] [CrossRef] [EDP Sciences] [Google Scholar]
- Saxton, R. D., Read, A. M., Komossa, S., et al. 2019, A&A, 630, A98 [NASA ADS] [CrossRef] [EDP Sciences] [Google Scholar]
- Saxton, R., Komossa, S., Auchettl, K., & Jonker, P. G. 2021, Space Sci. Rev., 217, 18 [NASA ADS] [CrossRef] [Google Scholar]
- Sazonov, S., Gilfanov, M., Medvedev, P., et al. 2021, MNRAS, 508, 3820 [NASA ADS] [CrossRef] [Google Scholar]
- Shappee, B., Prieto, J., Stanek, K. Z., et al. 2014, Am. Astron. Soc. Meet. Abstr., 223, 236.03 [Google Scholar]
- Shen, R.-F., & Matzner, C. D. 2014, ApJ, 784, 87 [NASA ADS] [CrossRef] [Google Scholar]
- Smartt, S., Valenti, S., Fraser, M., et al. 2015, A&A, 579, A40 [NASA ADS] [CrossRef] [EDP Sciences] [Google Scholar]
- Steinberg, E., & Stone, N. C. 2024, Nature, 625, 463 [NASA ADS] [CrossRef] [Google Scholar]
- Steiner, J. F., Narayan, R., McClintock, J. E., & Ebisawa, K. 2009, PASP, 121, 1279 [Google Scholar]
- Stern, D., Assef, R. J., Benford, D. J., et al. 2012, ApJ, 753, 30 [Google Scholar]
- Svoboda, J., Guainazzi, M., & Merloni, A. 2017, A&A, 603, A127 [NASA ADS] [CrossRef] [EDP Sciences] [Google Scholar]
- Tamborra, F., Papadakis, I., Dovčiak, M., & Svoboda, J. 2018, MNRAS, 475, 2045 [CrossRef] [Google Scholar]
- Taubenberger, S., Floers, A., Vogl, C., et al. 2018, The Astronomer’s Telegram, 11395, 1 [Google Scholar]
- Titarchuk, L. 1994, ApJ, 434, 570 [NASA ADS] [CrossRef] [Google Scholar]
- Ulmer, A. 1999, ApJ, 514, 180 [Google Scholar]
- van Velzen, S., Gezari, S., Hammerstein, E., et al. 2021, ApJ, 908, 4 [NASA ADS] [CrossRef] [Google Scholar]
- Wang, Y., Pasham, D. R., Altamirano, D., et al. 2024, ApJ, 962, 78 [Google Scholar]
- Wen, S., Jonker, P. G., Stone, N. C., Zabludoff, A. I., & Psaltis, D. 2020, ApJ, 897, 80 [NASA ADS] [CrossRef] [Google Scholar]
- Wen, S., Jonker, P. G., Stone, N. C., Van Velzen, S., & Zabludoff, A. I. 2023, MNRAS, 522, 1155 [NASA ADS] [CrossRef] [Google Scholar]
- Wevers, T. 2020, MNRAS, 497, L1 [NASA ADS] [CrossRef] [Google Scholar]
- Wevers, T., van Velzen, S., Jonker, P. G., et al. 2017, MNRAS, 471, 1694 [NASA ADS] [CrossRef] [Google Scholar]
- Wevers, T., Pasham, D. R., van Velzen, S., et al. 2019, MNRAS, 488, 4816 [Google Scholar]
- Wevers, T., Pasham, D. R., van Velzen, S., et al. 2021, ApJ, 912, 151 [NASA ADS] [CrossRef] [Google Scholar]
- Wevers, T., Pasham, D. R., Jalan, P., Rakshit, S., & Arcodia, R. 2022, A&A, 659, L2 [NASA ADS] [CrossRef] [EDP Sciences] [Google Scholar]
- Wevers, T., Coughlin, E. R., Pasham, D. R., et al. 2023, ApJ, 942, L33 [NASA ADS] [CrossRef] [Google Scholar]
- Wevers, T., Guolo, M., Pasham, D. R., et al. 2024, ApJ, 963, 75 [NASA ADS] [CrossRef] [Google Scholar]
- Willingale, R., Starling, R. L. C., Beardmore, A. P., Tanvir, N. R., & O’Brien, P. T. 2013, MNRAS, 431, 394 [Google Scholar]
- Wilms, J., Allen, A., & McCray, R. 2000, ApJ, 542, 914 [Google Scholar]
- Wright, E. L., Eisenhardt, P. R. M., Mainzer, A. K., et al. 2010, AJ, 140, 1868 [Google Scholar]
- Yao, Y., & Guolo, M. 2022, ATel., 15657, 1 [Google Scholar]
- Yao, Y., Lu, W., Guolo, M., et al. 2022, ApJ, 937, 8 [NASA ADS] [CrossRef] [Google Scholar]
- Yuan, W., Komossa, S., Zhang, C., et al. 2016, IAU Symp., 312, 68 [Google Scholar]
- Zauderer, B. A., Berger, E., Margutti, R., et al. 2013, ApJ, 767, 152 [NASA ADS] [CrossRef] [Google Scholar]
- Zdziarski, A. A., Szanecki, M., Poutanen, J., Gierliński, M., & Biernacki, P. 2020, MNRAS, 492, 5234 [NASA ADS] [CrossRef] [Google Scholar]
Appendix A: Spectral analysis of the adjacent source 2SXPS J140442.5-251104
Spectral products were extracted from Swift-XRT observations of the source, 2SXPS J140442.5-251104, which lies at a distance of 67 arcseconds from XMMSL2 J1404-2511, using the on-line XRT data products tool. A fit was performed yielding a good fit ( ) for a power-law of slope
  , absorbed by the Galactic column of NH = 6.7 × 1020 cm−2 and a further intrinsic absorber of NH, i = 2.3 ± 0.5 × 1021 cm−2 both modelled with the TBABS model. No appreciable variability was found in the light curve of the source with in-band fluxes of F0.2 − 2 keV = 5.5 × 10⁻¹⁴ ergs s−1 cm−2 and F2 − 10 keV = 1.9 × 10⁻¹³ ergs s−1 cm−2.
Appendix B: X-ray short-term light curve and black hole mass
In Fig. B.1 we show the 0.2-2 keV light curve of the 2018-07-17 XMM-Newton observation. This has a minimum doubling time of about 200s. Applying the relationship between X-ray variability and mass derived in Ponti et al. (2012) we obtain a black hole mass of  M⊙. From the K magnitude and the correlation of Marconi & Hunt (2003) we find a mass of
  . The mass obtained from fitting the optical spectrum line widths was
  (Section 3). We can also use the X-ray spectral properties to estimate MBH. We fit the thermally dominated, first Swift-XRT observation (S1) with an accretion disc model ( TDEDISCSPEC; Mummery et al. 2023), obtaining a radius
  cm and peak temperature
  K (
K ( eV). From the relationship between RP and MBH given in Mummery et al. (2023) we derive
  M⊙. Finally, using the galaxy stellar mass of log M* = 10.4, obtained from the SED fit shown in Fig. 3, and the relationship given in (Greene et al. 2020), we derive MBH = 2 × 10⁷ M⊙ with a systematic error of 0.8 dex. As all mass measurements are consistent within the errors we adopt
  .
.
We barycentre-corrected the light curve, binned it into 10 second bins and exposure corrected with the epiclccorr task, from the SAS software (Gabriel et al. 2004), to search for any periodicity. None was found.
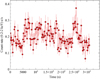 |
Fig. B.1. Soft X-ray light curve of XMMSL2 J1404-2511 from the XMM-Newton pointed observation of 2018-07-17, binned into 200s bins. |
Appendix C: Disc model spectral fits
Spectral fits to XMM-Newton and Swift-XRT observations of 2MASX 1404-25 are given in table C.1. Bolometric disc luminosity is calculated from equation 13 of Mummery et al. (2023) while the additional luminosity due to upscattered photons is found from the difference between the bolometric luminosity with the best fit SIMPL scattering fraction fc and the same with fc set to 0.
Fits of Comptonised thermal disc emission to XMM-Newton and Swift-XRT observations of 2MASX 1404-25
All Tables
Fits of a Comptonised black-body to XMM-Newton, Swift-XRT and SRG/eROSITA observations of 2MASX 1404-25.
Fits of Comptonised thermal disc emission to XMM-Newton and Swift-XRT observations of 2MASX 1404-25
All Figures
|
Fig. 1. Finder chart of XMMSL2 J1404-2511 based on an r’ band image from the Legacy DR10 survey performed on DECam on the Blanco CT10 telescope. Red circle is the XMM-Newton slew error circle of 8 arcseconds radius and the white circle is the Swift-UVOT enhanced position with an error of 1.9 arcseconds. |
| In the text | |
|
Fig. 2. Optical spectrum of 2MASX 1404-25 taken with the NTT on 2018-03-08 as part of the ePESSTO program. |
| In the text | |
|
Fig. 3. Host galaxy photometry based on GALEX (Martin et al. 2005), DECaLS (Dey et al. 2019), and WISE (Wright et al. 2010; Mainzer et al. 2011). We also include the post-peak aperture photometry in the UVOT B- and U-band. We show samples from the posterior distribution of population synthesis galaxy models (Conroy et al. 2009; Johnson & Leja 2017), following the method outlined in van Velzen et al. (2021). The predicted magnitudes (including UVOT W1, M2, and W2) are shown with open circles. |
| In the text | |
|
Fig. 4. Light curve of XMMSL2 J1404-2511 in the Swift-UV filters (upper) and in V and G filters from the ASAS-SN Sky Patrol v2.0 project (Hart et al. 2023; Shappee et al. 2014) (lower) where the vertical green lines indicate the dates of the three flares seen in X-ray data. Magnitudes represent the host galaxy light, which dominates in the optical filters, plus light from the TDE which dominates in the UV. |
| In the text | |
|
Fig. 5. Observed soft X-ray (0.2-2 keV) flux light curve of XMMSL2 J1404-2511 during 2018 and 2019. XMM-Newton points are shown as red circles and Swift-XRT points as blue diamonds or a blue downward triangle for the upper limit. Fluxes have been calculated using the spectral model COMPBB (see Table 3). |
| In the text | |
|
Fig. 6. Swift-XRT spectra of XMMSL2 J1404-2511 from 2018-02-28 fitted with a black-body (black) and 2019-03-19 fitted with a COMPBB model (red). |
| In the text | |
|
Fig. 7. Left: Slope of a power-law model absorbed by the Galactic column fitted to the X-ray spectra of XMMSL2 J1404-2511. Red points are from XMM-Newton, blue points from Swift-XRT. Middle: Temperature (eV) of a simple model of a black-body absorbed by the Galactic column of NH = 6.7 × 1020 cm−2 fitted to the X-ray spectra of XMMSL2 J1404-2511. Note that this does not represent the physical temperature of the disc but illustrates how the spectrum hardens with time. Right: Optical depth of a 5 keV electron population derived from fits of a COMPBB model, absorbed by the Galactic column, to X-ray spectra of XMMSL2 J1404-2511 from 2018 and 2019. |
| In the text | |
|
Fig. 8. Bolometric correction factor for 0.2–2 keV emission from a single temperature thermal spectrum (red) and a Comptonised thermal spectrum with electrons of temperature 2 keV and τ = 2 (blue) and 5 keV with τ = 1 (green), plotted against the peak temperature of the thermal component. |
| In the text | |
|
Fig. 9. X-ray (red circles), host-subtracted, absorption-corrected, UVOT-UVW2 filter (blue squares) and bolometric (green diamonds) luminosity light curves. Bolometric luminosities have been calculated from fits of a Comptonised thermal disc model to the X-ray spectra (see Section 5.1). Solid red line gives a fit of constant flux in the early phase and a decay of t−5.2 from day 100 to the X-ray luminosity. Dashed green line gives the same for the bolometric luminosity with a decay of t−4.6. Grey vertical dashed lines indicate the times of the radio non-detections. |
| In the text | |
|
Fig. 10. Upper: EPIC-pn, 0.2–2 keV image of XMMSL2 J1404-2511 taken on 2019-01-10, Middle: Epic-pn, 2–10 keV image, Lower: NuSTAR, FPA, 3–100 keV image centred on the position of XMMSL2 J1404-2511. The source, whose position is denoted by a green circle, is not detected in the latter two images. |
| In the text | |
|
Fig. 11. Upper: X-ray (red circles) and host-subtracted, Galactic absorption-corrected, UVOT-UVW2 filter (blue squares) luminosity light curves. The modelled host galaxy UVW2 luminosity is shown for reference (pink dashed line), Lower: Full X-ray observed flux light curve calculated using the COMPBB model (see Table 3). The dotted line represents a flare consisting of a 50 day rise to a 100 day plateau of 2.5 × 10⁻¹² ergs s−1 cm−2 and a 200 day decay with index t−5, repeating every 710 days. Downward triangles denote 2-sigma upper limits. |
| In the text | |
|
Fig. 12. Optical depth and observed 0.2–2 keV flux for the first 152 days of observations of XMMSL2 J1404-2511 using a spectral model of COMPBB with kTe = 5 keV. The shaded areas represent 90% confidence intervals on the measured parameters. |
| In the text | |
|
Fig. B.1. Soft X-ray light curve of XMMSL2 J1404-2511 from the XMM-Newton pointed observation of 2018-07-17, binned into 200s bins. |
| In the text | |
Current usage metrics show cumulative count of Article Views (full-text article views including HTML views, PDF and ePub downloads, according to the available data) and Abstracts Views on Vision4Press platform.
Data correspond to usage on the plateform after 2015. The current usage metrics is available 48-96 hours after online publication and is updated daily on week days.
Initial download of the metrics may take a while.