Open Access
Fig. 5.
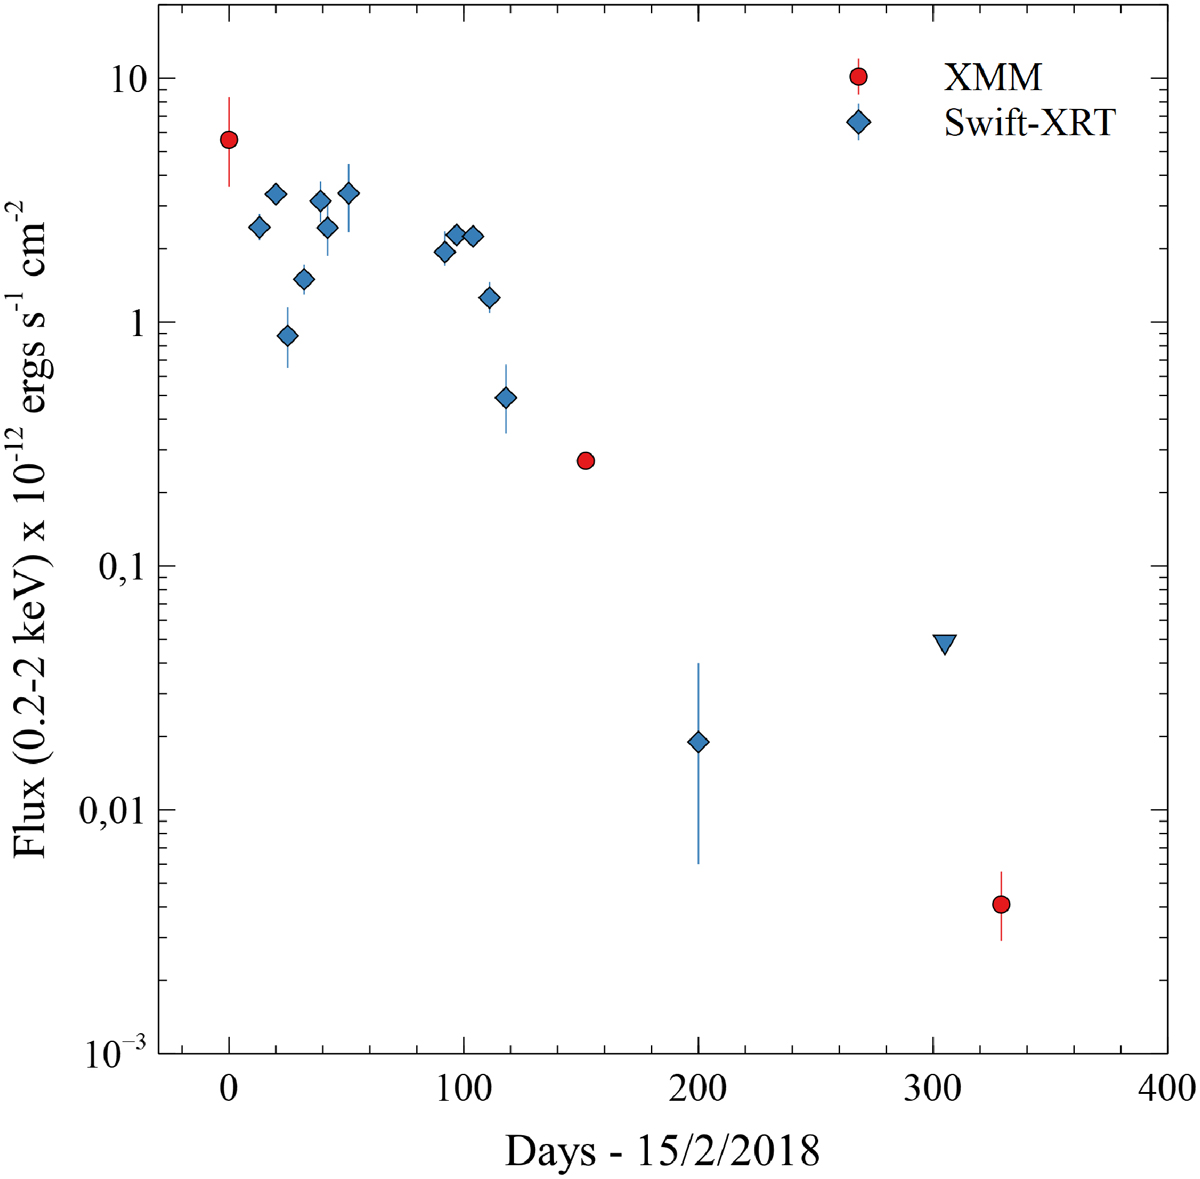
Download original image
Observed soft X-ray (0.2-2 keV) flux light curve of XMMSL2 J1404-2511 during 2018 and 2019. XMM-Newton points are shown as red circles and Swift-XRT points as blue diamonds or a blue downward triangle for the upper limit. Fluxes have been calculated using the spectral model COMPBB (see Table 3).
Current usage metrics show cumulative count of Article Views (full-text article views including HTML views, PDF and ePub downloads, according to the available data) and Abstracts Views on Vision4Press platform.
Data correspond to usage on the plateform after 2015. The current usage metrics is available 48-96 hours after online publication and is updated daily on week days.
Initial download of the metrics may take a while.