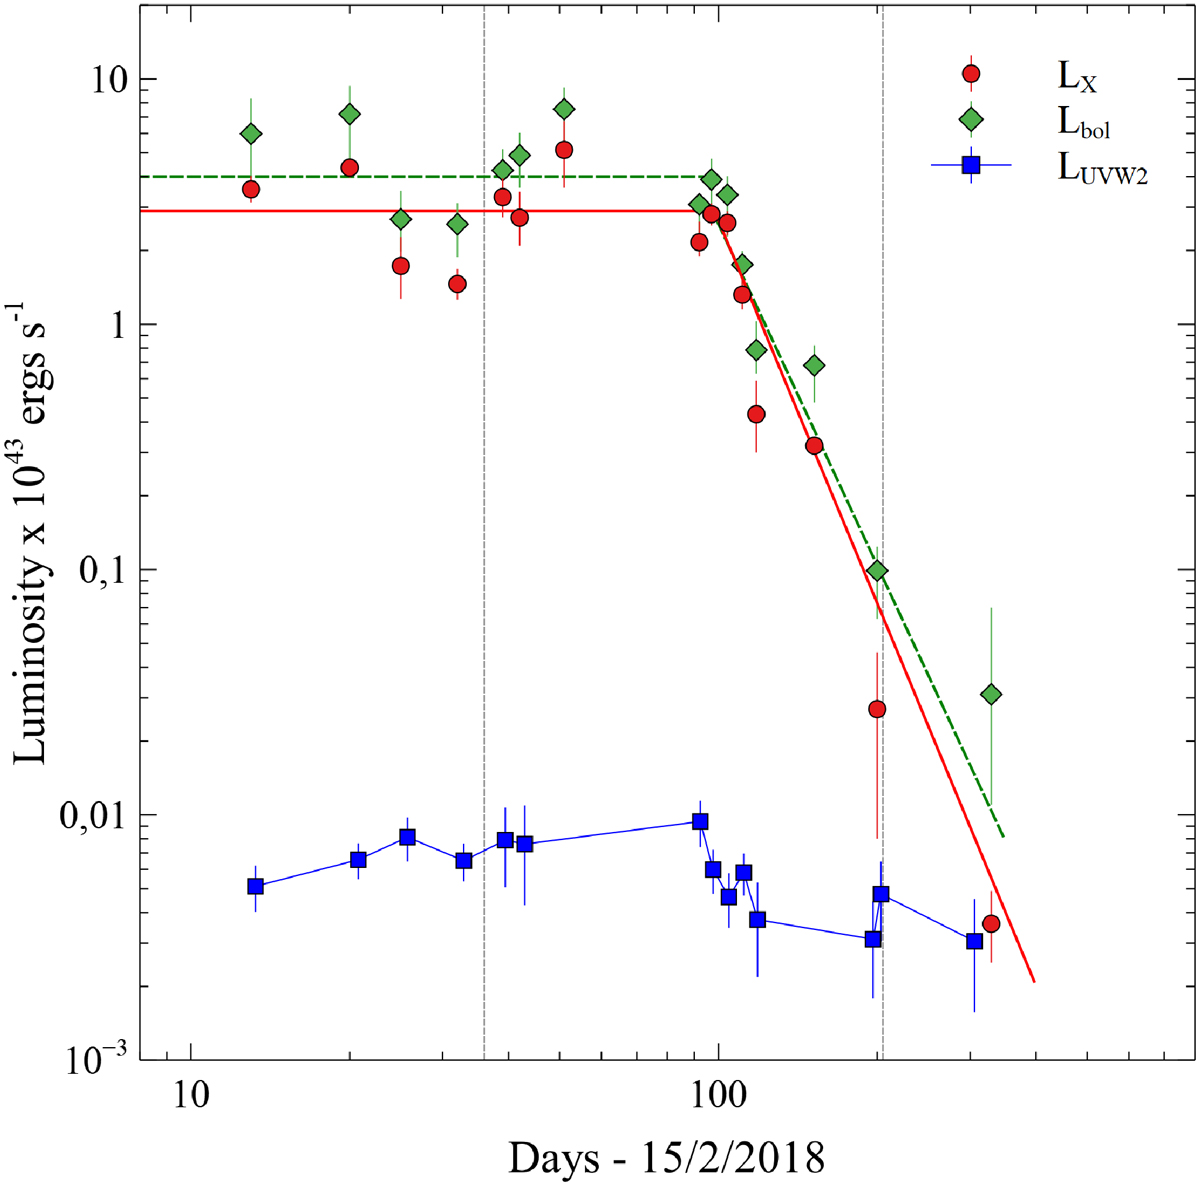
Fig. 9.
Download original image
X-ray (red circles), host-subtracted, absorption-corrected, UVOT-UVW2 filter (blue squares) and bolometric (green diamonds) luminosity light curves. Bolometric luminosities have been calculated from fits of a Comptonised thermal disc model to the X-ray spectra (see Section 5.1). Solid red line gives a fit of constant flux in the early phase and a decay of t−5.2 from day 100 to the X-ray luminosity. Dashed green line gives the same for the bolometric luminosity with a decay of t−4.6. Grey vertical dashed lines indicate the times of the radio non-detections.
Current usage metrics show cumulative count of Article Views (full-text article views including HTML views, PDF and ePub downloads, according to the available data) and Abstracts Views on Vision4Press platform.
Data correspond to usage on the plateform after 2015. The current usage metrics is available 48-96 hours after online publication and is updated daily on week days.
Initial download of the metrics may take a while.