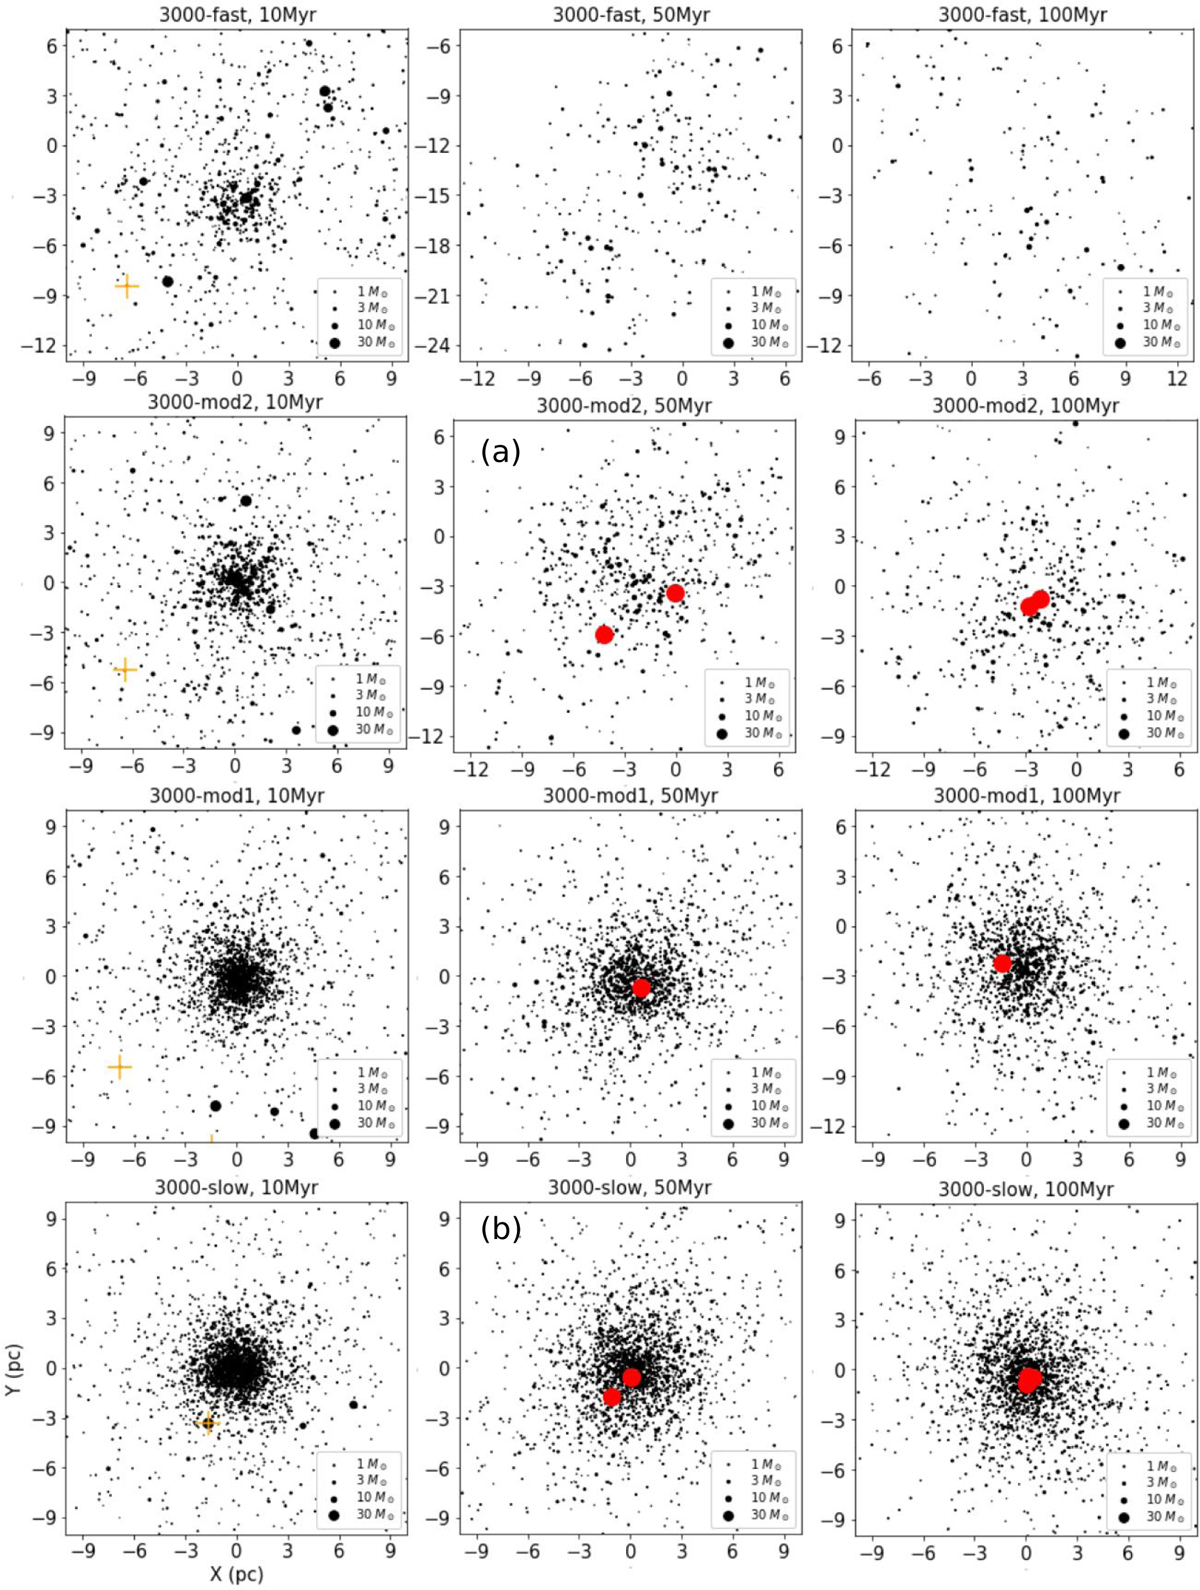
Fig. 4
Download original image
Evolution of 3000 M⊙ cluster under different gas-expulsion modes. Snapshots projected on the XY plane (20 pc × 20 pc around the cluster center) at ages 10 Myr, 50 Myr, and 100 Myr are shown here. The size of the black dots reflects the stellar mass (linear scale). Neutron stars and black holes are represented by orange plus signs and red dots, respectively, with the symbol sizes being purely illustrative. The central regions of the star clusters in Figs. 4a and b contain two and three black holes, respectively. In panel b, two of the three black holes are too close to be distinguished on the map.
Current usage metrics show cumulative count of Article Views (full-text article views including HTML views, PDF and ePub downloads, according to the available data) and Abstracts Views on Vision4Press platform.
Data correspond to usage on the plateform after 2015. The current usage metrics is available 48-96 hours after online publication and is updated daily on week days.
Initial download of the metrics may take a while.