Fig. 1
Download original image
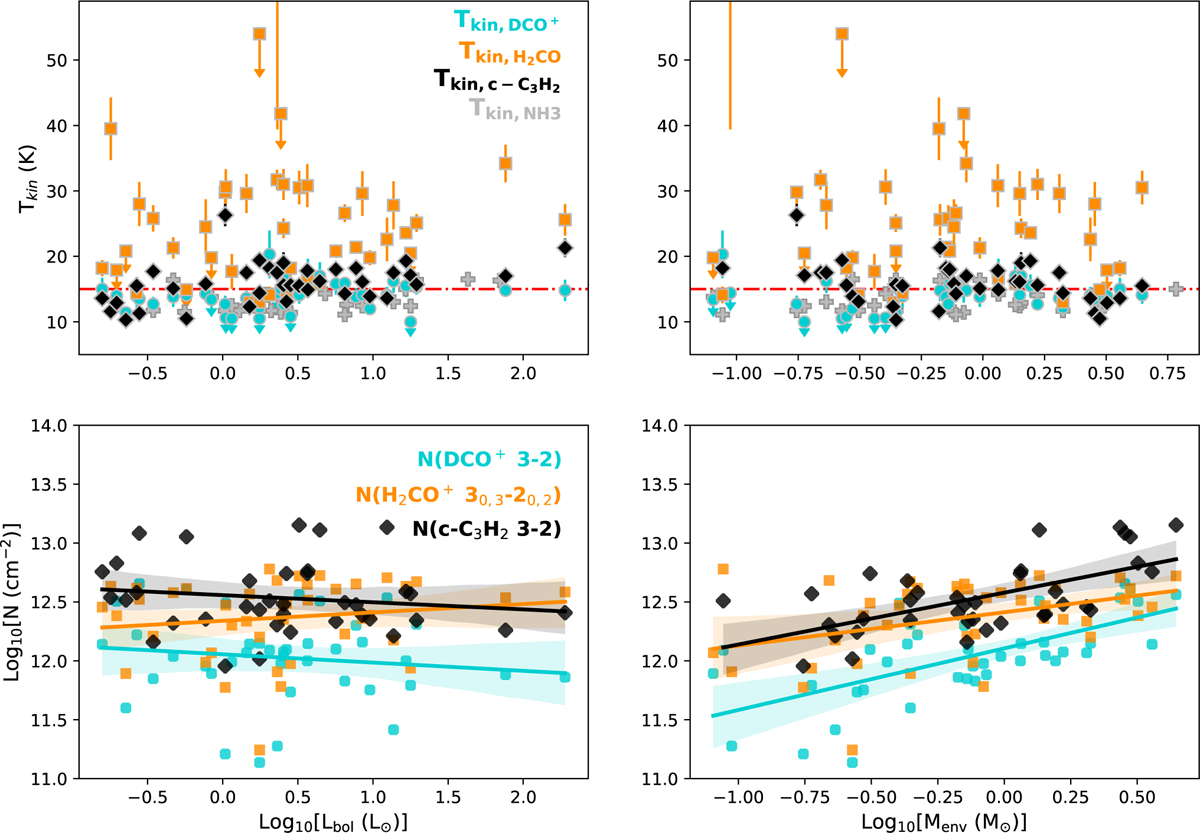
Physical parameters derived from APEX observations. Top row : gas kinetic temperature and corresponding errors obtained from molecular line ratios. Cyan circles show the temperature obtained from DCO+ J=5-4/J=3-2, orange squares show the average temperature obtained from the three H2CO ratios, and black diamonds show the average temperature obtained from the two c-C3H2 ratios. Upper limits are indicated with a downward arrow. The horizontal dash-dotted red line indicates the average gas kinetic temperature (Tkin ~15 K) derived from the I(HCN)∕I(HNC) J =1-0 (Paper I). The gray crosses show the gas kinetic temperature from NH3 observations (Tkin,NH3) obtained from the core catalog of Rosolowsky et al. (2008). The left and right panels plot gas kinetic temperature versus bolometric luminosity (Lbol) and envelope dust mass (Menv), respectively. Bottom row : column density for DCO+ (cyan circles), H2CO (orange squares), and c-C3H2 (black diamonds) obtained from the respective lowest transition in the APEX data. Solid lines and shaded areas show the linear regression for the data with the corresponding color. The left and right panels plot column density versus Lbol and Menv. Error bars are smaller than the symbols.
Current usage metrics show cumulative count of Article Views (full-text article views including HTML views, PDF and ePub downloads, according to the available data) and Abstracts Views on Vision4Press platform.
Data correspond to usage on the plateform after 2015. The current usage metrics is available 48-96 hours after online publication and is updated daily on week days.
Initial download of the metrics may take a while.