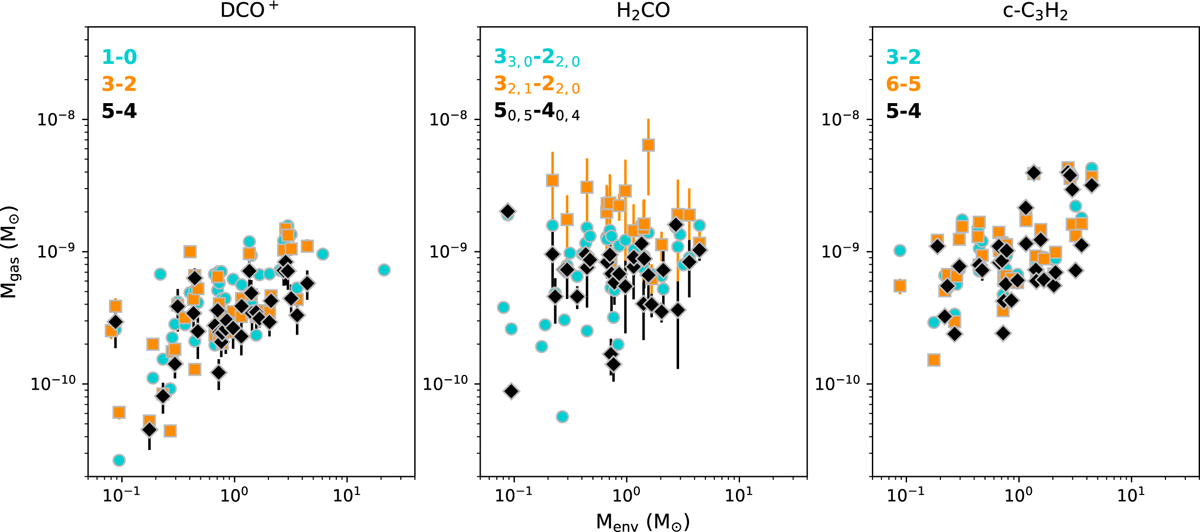
Fig. 2
Download original image
Gas mass (Mgas) versus dust mass (Menv) for all transitions of DCO+ (left panel), H2CO (center panel), and c-C3H2 (right panel). This plot shows that the gas masses from DCO+ and c-C3H2 are consistent between transitions, while H2CO shows a broader spread. In the center panel, the gas mass from H2CO 32,2-22,1 is not shown to avoid a crowded plot, but follows a similar distribution to the other transitions shown in the panel.
Current usage metrics show cumulative count of Article Views (full-text article views including HTML views, PDF and ePub downloads, according to the available data) and Abstracts Views on Vision4Press platform.
Data correspond to usage on the plateform after 2015. The current usage metrics is available 48-96 hours after online publication and is updated daily on week days.
Initial download of the metrics may take a while.