Fig. 3
Download original image
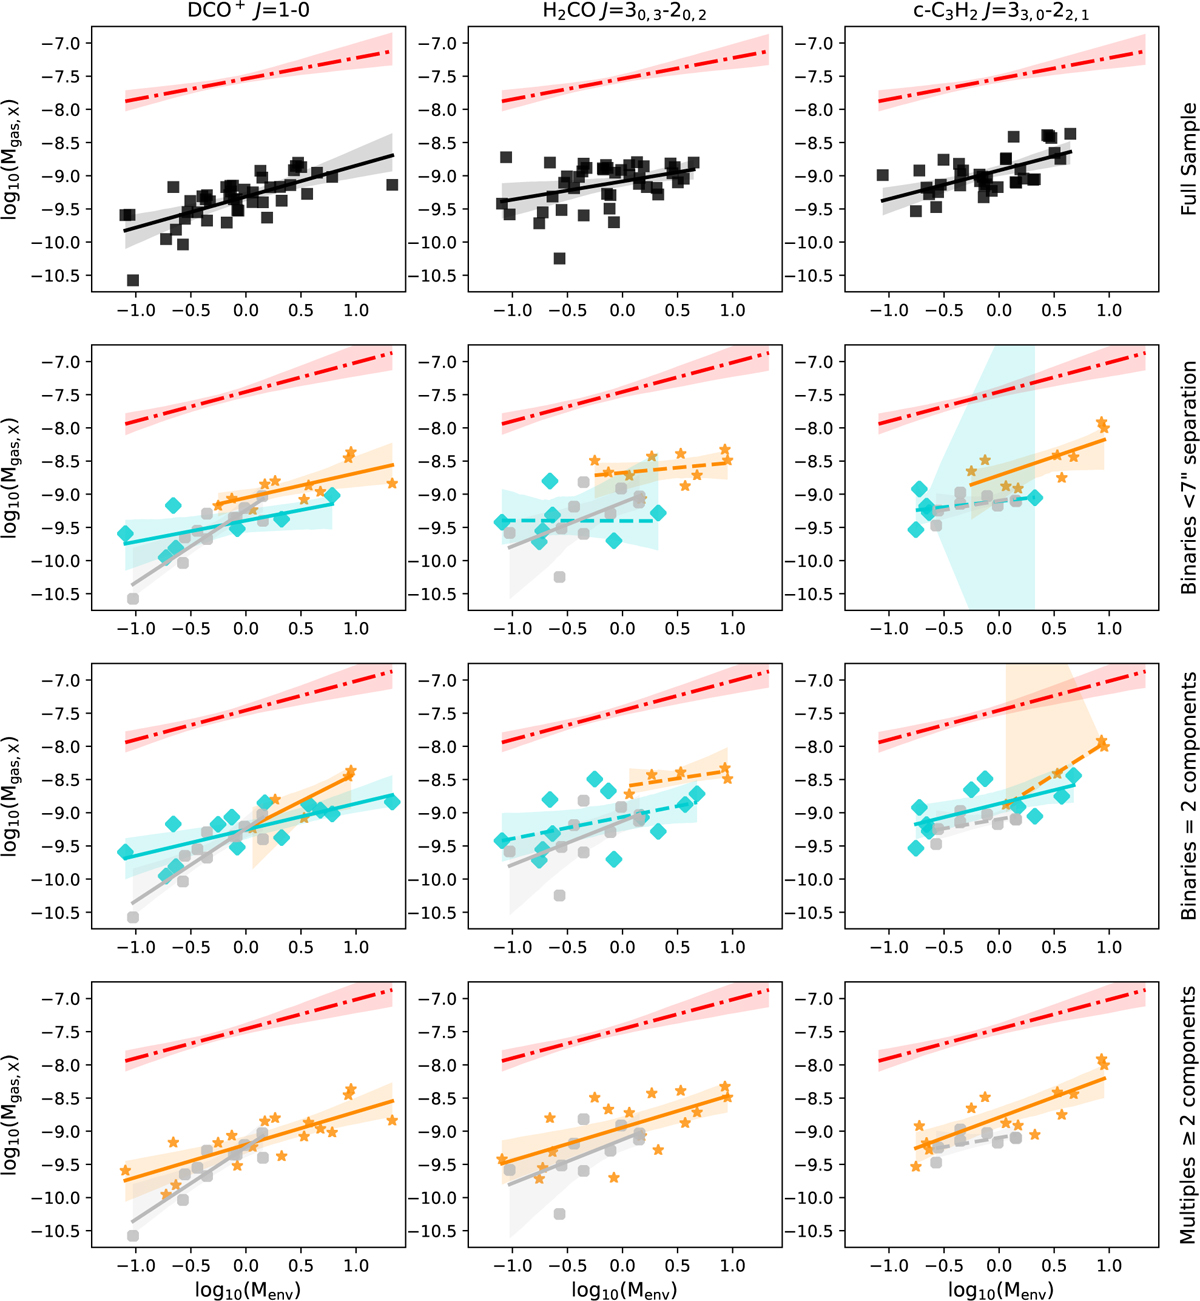
Relations of the DCO+ J =1-0 gas mass (MDCO+, left column), H2CO J=30,3-20,2 gas mass (MH2CO, center column), and c-C3H2 J=33,0-22,1 gas mass (Mc-C3H2, right column) versus envelope dust mass (Menv) for the sample. In all panels the dash-dotted red line shows the N2H+ gas mass versus envelope dust mass from Paper I as reference. The full sample with no differentiation for multiplicity is shown in the top row. In the other three rows, orange stars indicate multiple protostellar systems, cyan diamonds show binary systems, and gray circles indicate single protostellar systems. Each row represents one of four ways of grouping the sample and their corresponding correlations (see Sect. 4.4). Lines and shaded areas show the linear regression for the data with the corresponding color. Solid lines indicate statistically significant correlations in the subsamples (censored Kendall rank correlation p value of <0.05), while the dashed line shows subsamples with p values of >0.05.
Current usage metrics show cumulative count of Article Views (full-text article views including HTML views, PDF and ePub downloads, according to the available data) and Abstracts Views on Vision4Press platform.
Data correspond to usage on the plateform after 2015. The current usage metrics is available 48-96 hours after online publication and is updated daily on week days.
Initial download of the metrics may take a while.