Fig. C.1
Download original image
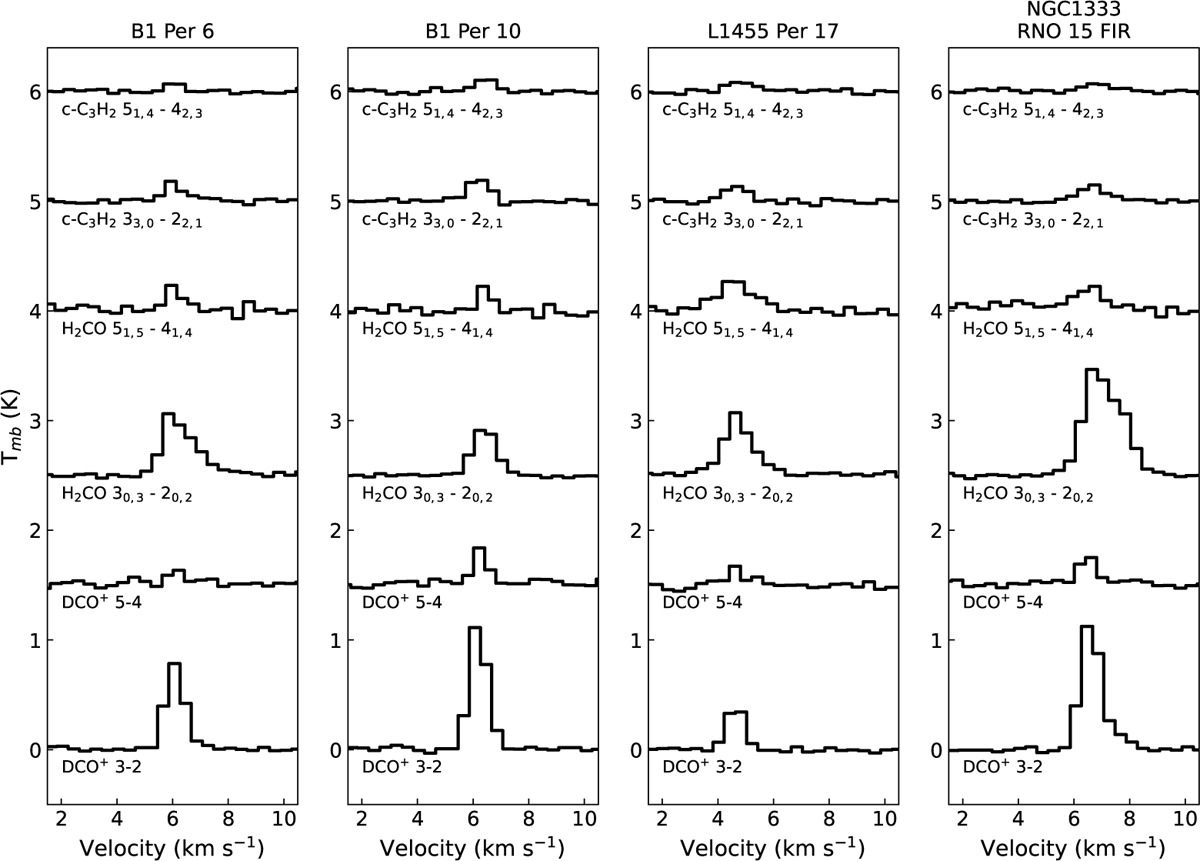
Sample of APEX spectra toward sources from the extended sample (see Sect. 2). The spectra for DCO+ J=5-4 and p-H2CO J=50,5-40,4 were obtained with APEX-2 with a beam of 18″, the other spectra were obtained with APEX-1 and a beam of 28.7″. From left to right, the first two panels show spectra for the components of the system B1 Per6+Per10. The third panel shows spectra for the close binary L1455 Per17. The fourth panel shows spectra for the single protostellar source NGC1333 RNO 15 FIR. The spectra are averaged to 0.4 km s−1 in order to increase sensitivity. All emission lines shown are found to have S/N ≥5 based on GILDAS/CLASS Gaussian fitting routines.
Current usage metrics show cumulative count of Article Views (full-text article views including HTML views, PDF and ePub downloads, according to the available data) and Abstracts Views on Vision4Press platform.
Data correspond to usage on the plateform after 2015. The current usage metrics is available 48-96 hours after online publication and is updated daily on week days.
Initial download of the metrics may take a while.