Fig. 2.
Download original image
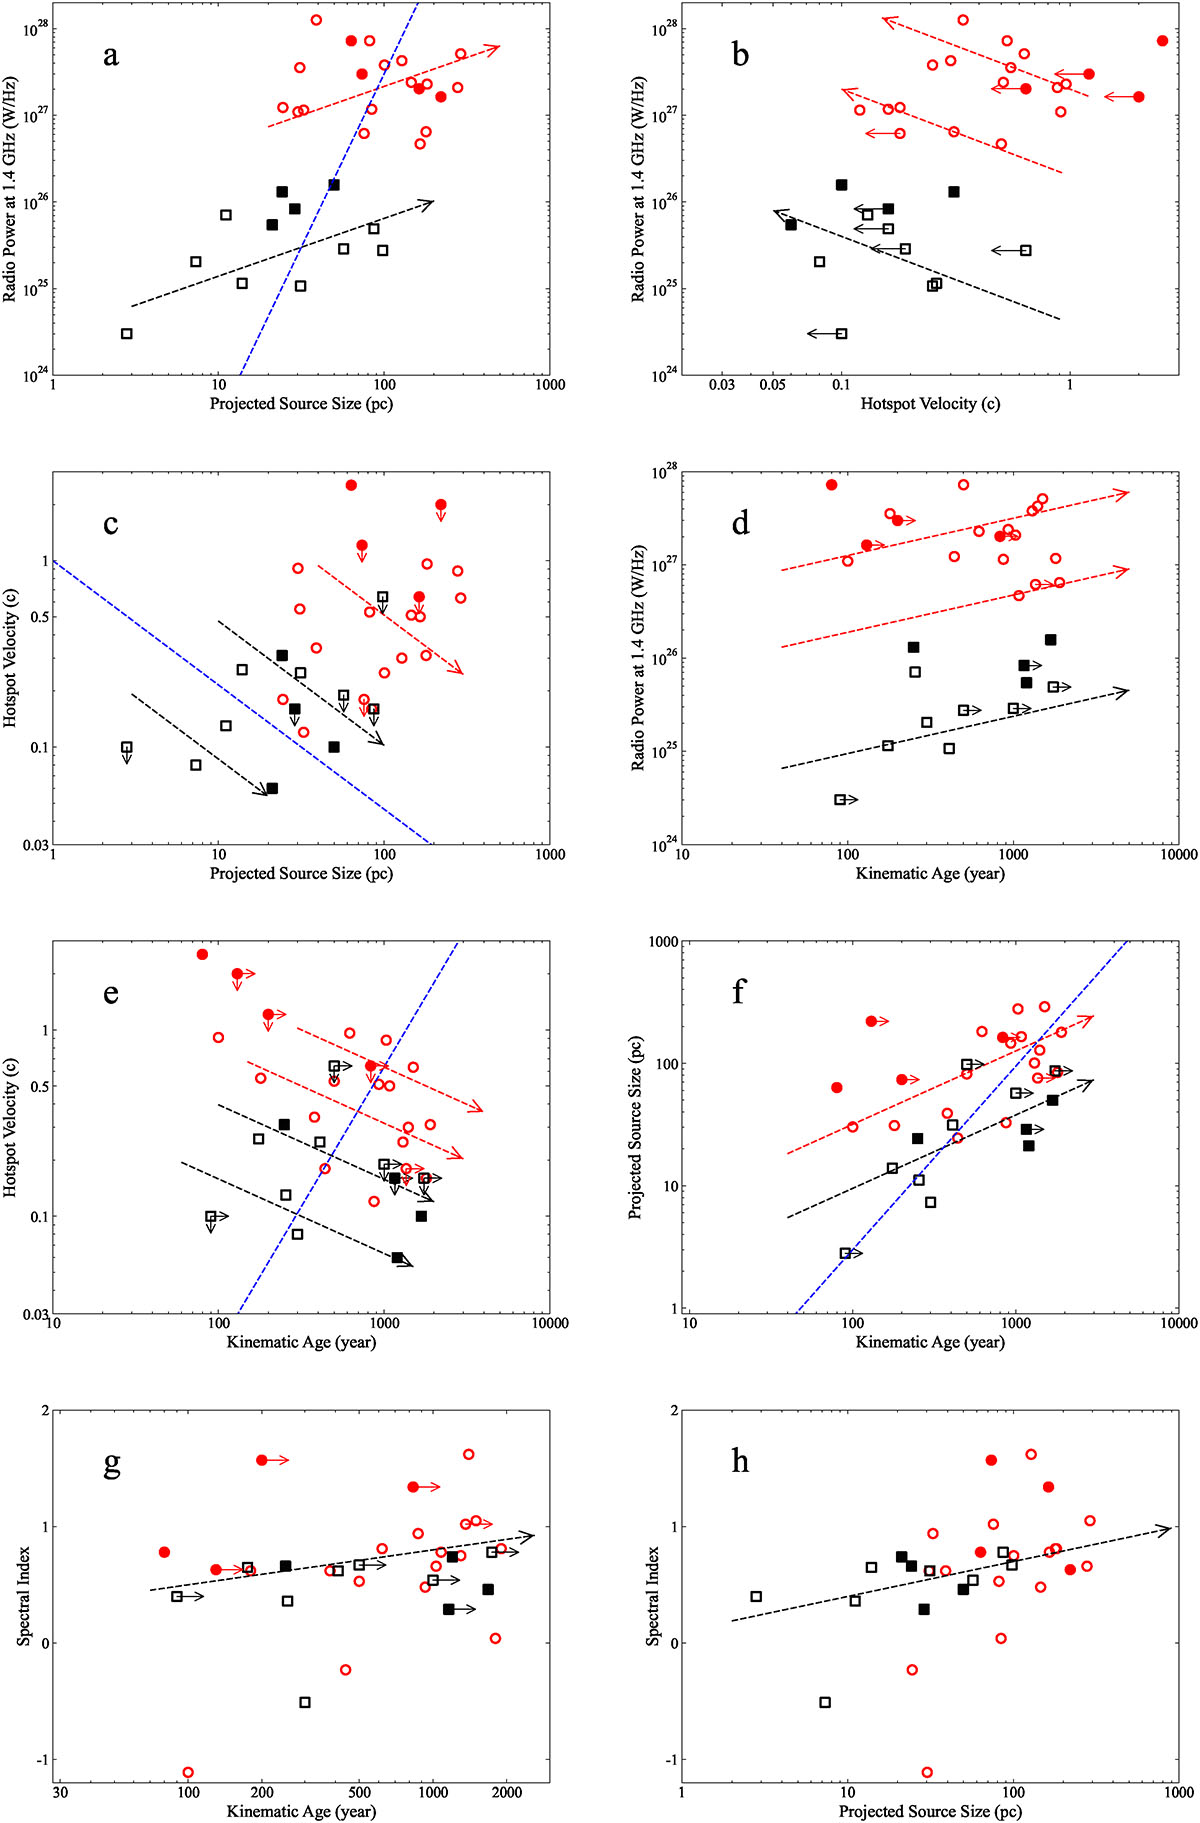
Parameter distributions of sample of 32 CSO sources combined with model predictions. Black symbols denote low-power CSOs (Prad < 1026.5 W Hz−1) and red symbols represent high-power CSOs. The filled symbols are from the current study and the open symbols are from An & Baan (2012). Dashed red and black arrows relate to evolutionary trend for high- and low-power source distributions. The dashed blue lines in panels a, c, and f show the general power trend of the groups as a whole. The dashed blue line in panel b shows the expected survival threshold for low power sources. Panel a: Dashed red and black arrows denote the predicted Prad ∝ D2/3 adiabatic-loss-dominated evolution of a source with constant power, and the dashed blue line indicates the predicted power-size distribution: Prad ∝ D4. Panel b: Dashed red and black arrows show the predicted inverse relationship between radio power and hotspot velocity: ![]() . Panel c: Hotspot velocity varies with the projected source size as VHS ∝ D−2/3. Panel d: Dashed arrows show the predicted evolutionary relation of Prad ∝ T2/5. Panels e and f: Dashed arrows indicate the predicted evolution following VHS ∝ T−2/5 and D ∝ T3/5. Panels g and h: Relatively flat distribution of spectral index shows a slight steepening toward α = 1 with increasing kinematic age, T, and with projected source size, D.
. Panel c: Hotspot velocity varies with the projected source size as VHS ∝ D−2/3. Panel d: Dashed arrows show the predicted evolutionary relation of Prad ∝ T2/5. Panels e and f: Dashed arrows indicate the predicted evolution following VHS ∝ T−2/5 and D ∝ T3/5. Panels g and h: Relatively flat distribution of spectral index shows a slight steepening toward α = 1 with increasing kinematic age, T, and with projected source size, D.
Current usage metrics show cumulative count of Article Views (full-text article views including HTML views, PDF and ePub downloads, according to the available data) and Abstracts Views on Vision4Press platform.
Data correspond to usage on the plateform after 2015. The current usage metrics is available 48-96 hours after online publication and is updated daily on week days.
Initial download of the metrics may take a while.