| Issue |
A&A
Volume 704, December 2025
|
|
|---|---|---|
| Article Number | A93 | |
| Number of page(s) | 13 | |
| Section | Extragalactic astronomy | |
| DOI | https://doi.org/10.1051/0004-6361/202554322 | |
| Published online | 05 December 2025 | |
Identifying compact symmetric objects with high-precision VLBI and Gaia astrometry
1
Shanghai Astronomical Observatory, Key Laboratory of Radio Astronomy, CAS, 80 Nandan Road, Shanghai 200030, China
2
State Key Laboratory of Radio Astronomy and Technology, A20 Datun Road, Chaoyang District, Beijing, PR China
3
Konkoly Observatory, HUN-REN Research Center for Astronomy and Earth Sciences, Konkoly Thege Miklós út 15-17, H-1121 Budapest, Hungary
4
CSFK, MTA Centre of Excellence, Konkoly Thege Miklós út 15-17, H-1121 Budapest, Hungary
5
Institute of Physics and Astronomy, ELTE Eötvös Loránd University, Pázmány Péter sétány 1/A, H-1117 Budapest, Hungary
6
Xinjiang Astronomical Observatory, CAS, 150 Science-1 Street, Ürümqi, Xinjiang 830011, PR China
7
Netherlands Institute for Radio Astronomy, ASTRON, Oude Hoogeveensedijk 4, 7991 PD Dwingeloo, The Netherlands
⋆ Corresponding author: This email address is being protected from spambots. You need JavaScript enabled to view it.
Received:
28
February
2025
Accepted:
27
September
2025
Abstract
Context. Compact symmetric objects (CSOs) trace the earliest phases of radio-galaxy growth; however, robust classification is difficult when radio cores are weak or invisible.
Aims. We aim to develop and test a Gaia+VLBI approach that utilizes the high-precision optical astrometry of Gaia together with the high-resolution imaging of very long baseline interferometry (VLBI) to reliably locate the central engine and classify CSOs.
Methods. We analysed 40 literature CSO candidates by overlaying Gaia Data Release 3 (DR3) positions on VLBI maps and by examining spectral index distributions, whole-source variability, and hotspot kinematics over up to 25 years. A source is classified as a CSO when the Gaia centroid lies between two steep-spectrum lobes; alignment with one end of the radio structure indicates a core–jet source.
Results. Our method yields 20 confirmed CSOs, ten core–jet sources, and ten ambiguous cases affected by significant optical–radio positional offsets or limited data. The confirmed CSOs show low integrated variability, hotspot advance speeds typically < 0.5 c, where c denotes the speed of light (with a few mildly relativistic cases), and kinematic ages of ≈20 − 2000 yr. Five nearby CSOs show systematic Gaia–VLBI offsets despite the CSO-like morphology, likely reflecting host-galaxy environments and Gaia astrometric systematics. We find a clear dichotomy with radio power: high-power CSOs (P1.4 GHz > 1026.5 W Hz−1) tend to be larger and host faster hotspots, while many low-power systems remain sub-kiloparsec and environmentally confined.
Conclusions.Gaia+VLBI registration is a powerful method for CSO classification, especially where radio cores are faint. The observed power-size-velocity-age relations support distinct multiple evolutionary tracks, with high-power CSOs plausibly growing into large radio galaxies, while low-power CSOs appear confined by their host galaxy environments. Taken together, our results indicate that CSO evolution is shaped not only by intrinsic jet power, but also by host–galaxy environment and the duty cycle of the central engine. High-sensitivity observations of low-power CSOs will be crucial to map the full diversity of formation channels and evolutionary pathways of radio galaxies.
Key words: astrometry / galaxies: active / galaxies: jets / galaxies: nuclei / quasars: general
© The Authors 2025
 Open Access article, published by EDP Sciences, under the terms of the Creative Commons Attribution License (https://creativecommons.org/licenses/by/4.0), which permits unrestricted use, distribution, and reproduction in any medium, provided the original work is properly cited.
This article is published in open access under the Subscribe to Open model. This email address is being protected from spambots. You need JavaScript enabled to view it. to support open access publication.
1. Introduction
Compact symmetric objects (CSOs) represent a key early stage in radio galaxy growth, characterized by mirror-symmetric double-lobed morphology within a projected size of ≲1 kiloparsec (kpc) (Phillips & Mutel 1980, 1982; Pearson & Readhead 1981, 1988). These sub-kiloparsec, symmetric radio sources provide clean laboratories for jet–interstellar medium (ISM) coupling and nascent active galactic nucleus (AGN) feedback with minimal projection effects (Tadhunter 2016; Bicknell et al. 2018; O’Dea & Saikia 2021).
The physical nature of CSOs has been framed by three primary scenarios, which are as follows. (I) The young radio galaxy scenario suggests CSOs represent the earliest evolutionary stage of radio galaxies (e.g., Phillips & Mutel 1980; Readhead et al. 1996a; Owsianik & Conway 1998), supported by the observed “luminosity–size” relationship (Baldwin 1982), which indicates progression from CSOs to larger scale radio sources (e.g., Fanti et al. 1995; Snellen et al. 2000; Kunert-Bajraszewska et al. 2010; An & Baan 2012). However, this evolutionary path may only account for a small fraction of the overall CSO population, primarily those with high-power jets (L1.4 GHz > 1026.5 W Hz−1), while the fate of those with lower power and unstable jets is uncertain. (II) In the frustration model, CSOs are confined by dense ISM in their host galaxies (e.g., van Breugel et al. 1984; Wilkinson et al. 1984; O’Dea et al. 1991; De Young 1993), especially at low radio power, potentially linking them to Fanaroff–Riley (FR) type 0 (FR0) radio galaxies (Fanaroff & Riley 1974; Baldi et al. 2018, 2019). Even lower power radio sources (Chilufya et al. 2024) suggest a potential link to a previously unexplored low-power CSO population, where jet–ISM interactions significantly shape radio morphology. (III) The transient-phenomenon model suggests some CSOs may be short-lived, resulting from intermittent or episodic AGN activity. It is important to distinguish between “intermittent” (e.g., repeating cycles caused by accretion-disk instabilities, Janiuk et al. 2002; Czerny et al. 2009; Siemiginowska et al. 2010; Wu 2009) and “episodic” events (one-time phenomena such as tidal disruption events, TDEs, Readhead et al. 1996b, 2024). While the episodic TDE model can explain certain short-lived sources, it struggles to account for CSOs that evolve into larger radio galaxies or show multiple activity episodes (e.g., Schoenmakers et al. 2000; Kaiser et al. 2000; Marecki & Szablewski 2009; Joshi et al. 2011; Mahatma et al. 2019; Orienti et al. 2023). The presence of double-double radio lobes or remnant emission suggests that CSOs may undergo recurrent activity cycles (Machalski et al. 2010; Konar & Hardcastle 2013), requiring models that explain both transient and long-term evolutionary processes.
To understand radio-galaxy formation, precise quantification of CSO dynamics, ages, and triggering rates is crucial to establish their relationship with large-scale radio galaxies. CSOs provide unique insights into the birth and growth of radio galaxies through several key aspects: their compact size and youth provide direct windows into early-stage jet activity and jet–ISM interactions, while their symmetric double-lobed morphology, oriented close to the sky plane, minimizes relativistic beaming effects and reveals intrinsic jet properties.
Compact symmetric objects are essential for understanding AGN feedback mechanisms and galaxy evolution. They serve as laboratories for studying three critical processes: initial jet–ISM coupling in galactic nuclei, jet physics with minimal projection effects, and diverse evolutionary pathways spanning from high-power sources evolving into large radio galaxies to confined low-power sources. These characteristics make CSOs crucial to understanding how AGN feedback operates and influences galaxy evolution across cosmic time.
Despite their importance, identifying and understanding the physical nature of CSOs remains challenging. The primary difficulty lies in detecting their often weak or obscured radio cores (Gugliucci et al. 2005), caused by several factors. First, minimal relativistic beaming due to large inclination angles reduces core emission (Peck et al. 1999; Orienti et al. 2006; Marr et al. 2001; Orienti & Dallacasa 2008; An et al. 2012; Wu et al. 2013). Second, dense ionized gas in nuclear regions can cause significant attenuation through synchrotron self-absorption or free-free absorption (O’Dea 1998; Fanti 2009). Third, frequency-dependent opacity effects can shift apparent core positions, complicating identification.
Traditional CSO identification has relied on morphological and spectral criteria derived from high-resolution, very-long-baseline-interferometry (VLBI) observations. Key indicators include a symmetric double-lobed structure, steep-spectrum lobes, and low variability (e.g., Taylor et al. 1996a; Peck & Taylor 2000; Healey et al. 2007). However, distinguishing genuine CSOs from core–jet sources exhibiting similar structures remains difficult in the absence of clear core detection. While multifrequency VLBI observations provide supplementary evidence, uncertainties in CSO variability, dynamics and life cycles limit our ability to construct unbiased CSO samples.
To address these challenges, we introduce a new method combining high-precision optical astrometry from the Gaia space mission (Gaia Collaboration 2016) with high-resolution VLBI imaging to reliably identify genuine CSOs. Gaia Data Release 3 (DR3, Gaia Collaboration 2023) provides unprecedented astrometric precision (∼0.04 mas for bright sources with apparent optical magnitude G < 14mag and ∼0.7 mas at G = 20mag) for approximately 1.6 million quasar-like objects. When overlaid on VLBI maps, these precise optical positions pinpoint AGN central engines, even when radio cores are weak or undetectable.
This study applies this method to 40 CSO candidates selected from existing VLBI surveys (Section 2). By overlaying Gaia DR3 positions on multi-epoch, multifrequency VLBI maps, we were able to classify these objects and study their properties in detail.
The structure of this paper is as follows. Section 2 presents the methodology and parent sample. Section 3 presents the identification of CSOs and core–jet sources using the Gaia+VLBI method. Section 4 discusses the radio properties of the confirmed CSOs. The results are summarised in Section 5. Throughout this paper, we assume a standard flat Λ cold dark matter cosmology with H0 = 70 km s−1 Mpc−1, Ωm = 0.3, and ΩΛ = 0.7. The radio spectrum is defined as Sν ∝ ν−α, where Sν is the flux density at the observing frequency, ν; and α is the spectral index.
2. Method and samples
2.1. CSO identification criteria
We used four diagnostics for CSO identification:
-
Morphology. A compact, mirror-symmetric, double-lobed radio structure with projected linear size of < 1 kpc and a lobe-brightness ratio of < 10:1;
-
Spectral properties. Steep-spectrum lobes and a flat or inverted-spectrum core (when detected); convex or overall steep radio spectra are common;
-
Low integrated variability. Whole-source variability is typically < 20%;
-
Hotspot kinematics. Sub-relativistic hotspot advance speeds, typically < 0.5 c, where c denotes the speed of light.
In principle, a confirmed CSO satisfies all four criteria. In practice, items (3) and (4) require homogeneous, long-term monitoring and are not always available. We therefore used (1) and (2) for the initial classification and treated (3) and (4) as confirming tests where data exist. If any diagnostic conflicted with CSO expectations, we adopted the conservative label of CSO candidate (CSOc). Table 1 summarises, for each source, the diagnostics available and their outcomes, including the whole-source variability measurement.
Diagnostics applied to CSO and CSOc classes.
2.2. VLBI CSO sample
Our CSO candidate sample combines data from three representative CSO studies: the COINS (CSOs observed in the northern sky) sample Peck & Taylor (2000), the A&B2012 sample An & Baan (2012), and the T2016 sample Tremblay et al. (2016). These studies yielded over 140 candidates based on symmetric morphology and steep or convex radio spectra. After removing redundant sources (Fig. 1), we established a consolidated sample of 105 CSO candidates. While not comprehensive in sky coverage or flux-density limits, this dataset represents the most credible collection of CSOs and candidates confirmed through multiple criteria (primarily morphology and radio spectra), providing an effective testbed for our CSO identification technique. The sample spans a broad range of redshifts (0.015 to 1.791, median 0.269; Fig. S1 in Supplementary Material1).
 |
Fig. 1. Flowchart of our sample selection procedure. P&T2000: Peck & Taylor (2000); A&B2012: An & Baan (2012); T2016: Tremblay et al. (2016). The Radio Fundamental catalogue (RFC): http://astrogeo.org/rfc/ (Petrov & Kovalev 2025). Gaia DR3: https://www.cosmos.esa.int/web/gaia/data-release-3. |
We first selected 40 CSO candidates using Gaia+VLBI registration (Fig. 1), restricted to sources that already satisfy the morphological and radio spectral criteria. For objects with variability and/or hotspot motion measurements, any robust inconsistency with these diagnostics leads to a conservative downgrade to a CSOc. Some sources show large Gaia–VLBI offsets; however, strong independent-literature evidence supports their classification as CSOs (Table 1). Conversely, some objects show good Gaia–VLBI alignment, yet fail the low-variability or sub-relativistic hotspot speed expectations for standard CSOs, and are therefore tentatively listed as CSOc. We note minor discrepancies with classifications in Readhead et al. (in prep.; private communication) for a few objects; these do not affect our general conclusions and will be revisited as community lists converge.
2.3. Gaia+VLBI sample
We introduce a novel methodology that combines high-precision optical astrometry from Gaia with high-resolution VLBI imaging to reliably identify CSO cores. Previous comparisons between Gaia and VLBI astrometry have focused mainly on radio–optical positional offsets in core–jet systems (Petrov & Kovalev 2017). More recently, exploratory studies have begun to test the joint Gaia+VLBI approach for individual GHz-peaked-spectrum quasars (Kosogorov et al. 2024). Our work constitutes the first systematic application of this technique to a large CSO sample, directly addressing the long-standing difficulty of CSO core identification.
We cross-matched 105 VLBI-selected CSO candidates with Gaia DR3 sources using a conservative 1″ search radius and identified 40 robust optical counterparts (Table A.1). The Gaia optical centroid probes the immediate vicinity of the accretion disk and the central supermassive black hole (SMBH), thereby providing a stable reference for the AGN core position (see Sect. S2). When registered against VLBI maps with sub-milliarcsecond (mas) resolution, these optical centroids enable precise localization of the central engine, even when the radio core is faint or absorbed. The modest match fraction (38%) further indicates that many CSO nuclei are intrinsically optically faint or heavily obscured.
The cross-matched subset comprises a heterogeneous mix of quasars (∼45%) and galaxies (∼55%). From the redshift distribution (Fig. S1), most CSOs and candidates cluster at low and modrate redshifts (z < 1.0), which is largely set by the Gaia detection limit: galaxies beyond z ∼ 1 are often too faint for reliable Gaia astrometry. In contrast, core–jet sources show a broader redshift range.
We performed a detailed analysis using the latest DESI Data Release 1 (DESI Collaboration 2025) to assess the detection rates of CSO candidates. Out of our parent sample (105 sources), 63 fall within the DESI footprint, while 42 do not. Among the sources within the DESI footprint, those without Gaia counterparts (35 sources) show a low detection rate (∼20%) in DESI, with detected sources spanning a redshift range of z = 0.2 − 1.5. In contrast, Gaia-detected sources exhibit a higher detection rate (∼50%) in DESI. This stark difference in detection rates supports the notion that host-galaxy detection is significantly affected by distance. The Gaia non-detections recovered by DESI at higher redshifts confirm that many of these optically faint sources are distant galaxies, not intrinsically faint nearby objects. This result highlights the optical-selection bias and its effect on our CSO sample.
To assess astrometric quality, we screen Gaia solutions using G magnitude, the astrometric excess noise (AEN), and its significance (AENS) (Table S2), and we treat significant Gaia–VLBI offsets with caution. Particularly for faint sources (G ≳ 20 mag) or extended/structured hosts, low signal-to-noise ratios, asymmetry, or blending can bias the optical centroid and produce spurious Gaia–VLBI offsets, analogous cross-identification uncertainties were reported by Plavin et al. (2019). In such cases, we require independent radio diagnostics before rejecting a CSO classification. This behavior is exemplified by several nearby, well-studied CSOs in Table 1 (e.g., J1407+2827/OQ 208, J1511+0518, J1945+7055), which have strong literature CSO identifications yet show large Gaia–VLBI offsets attributable to Gaia astrometric systematics rather than genuine optical–radio displacements (see also Section 3.1).
This combined approach offers several advantages over traditional, radio-only identification: (i) precise nuclear localization even when the radio core is weak or obscured; (ii) reliable discrimination between CSOs and core–jet sources; (iii) an independent verification of the orientation of the radio structure; and (iv) improved kinematic measurements by anchoring component motions to a fixed, physically motivated reference point.
3. Results
Our application of the Gaia+VLBI method yielded classifications for 30 of 40 CSO candidates, demonstrating the effectiveness of combining high–precision optical astrometry with radio imaging. We confirmed 20 sources as bona fide CSOs, and identified ten as core–jet AGN (Figures S2–S3, Tables S3–S4). The remaining ten sources (Fig. S4, Table S5) are ambiguous due to significant radio–optical positional discrepancies.
3.1. Confirmed CSOs
Among the 20 confirmed CSOs, 15 show direct Gaia+VLBI alignment; the remaining five are well studied in the literature and are confirmed as CSOs by independent evidence, despite larger Gaia–VLBI offsets. Most exhibit classic double-lobed structures (e.g., J1111+1955, J1326+3154), while several show complex morphologies indicating jet-ISM interactions. Sources such as J0832+1832, J1158+2450, and J1815+6127 display asymmetric brightness where components closest to the core appear brightest, suggesting strong environmental influence. Additional evidence of the environment includes jet deflection (J0832+1832, J1815+6127), bending (J1158+2450), and clumpy morphology (J1244+4048). Multifrequency coverage is essential: 2.3-GHz data reveal extended, steep-spectrum features in J0741+2706, J0832+1832, J1256+5652, and J2355+4950 that are too faint at higher frequencies owing to spectral steepening and Doppler deboosting.
Lobes generally have steep spectra (α > 0.5) from aging relativistic electrons. Central regions generally show flatter spectra, steepening toward the lobes, consistent with opacity and/or ongoing particle injection near the core, followed by spectral aging as the plasma flows outward. Hotspots in young radio sources are expected to be optically thin with steep spectra (α ≳ 0.5). Flat or inverted spectral indices in some regions (e.g., NE jet of J1158+2450) are best explained by opacity effects (synchrotron or free-free absorption) or contamination from unresolved core/inner jet emission (Taylor et al. 1996b; Orienti & Dallacasa 2014).
Kinematic analysis (Table 2) reveals diverse hotspot separation speeds in our CSO sample. Most sources display sub-relativistic motions (< 0.5 c), which are characteristic of symmetric jet expansion in young radio galaxies. J1602+2418 shows mildly relativistic speed of (vHS = 2.54 ± 0.45) c, though with substantial uncertainties. J1111+1955 may exhibit an unusually high apparent speed that requires confirmation with longer time baseline. Estimated kinematic ages span ∼80 years (J1602+2418) to over 1600 years (J1234+4753), revealing diverse evolutionary stages. Three sources (J1110+4817, J1256+5652, J1815+6127) show apparent negative speeds, likely from structure changes or projection effects (An et al. 2012).
Proper motions in CSOs and some CSOcs.
Five nearby (z ≤ 0.1) CSOs – J0048+3157 (NGC 262, Mrk 348), J1247+6723, J1407+2827, J1511+0518, and J1945+7055 – show large radio–optical offsets despite characteristic CSO morphology and spectra. In J1407+2827 (OQ 208, Stanghellini et al. 1997; An et al. 2012; Wu et al. 2013), the Gaia position coincides with a radio lobe, likely due to bright optical emission from a jet–ISM interaction site. Host-galaxy factors (central asymmetries, host spectral components, and dust extinction) can shift optical centroids relative to VLBI positions (Plavin et al. 2019), and starburst/merging hosts can further increase Gaia uncertainties. These cases illustrate limitations of the Gaia+VLBI method for nearby, optically weak or obscured nuclei, but their CSO classification remains secure from morphology and spectra.
The projected linear sizes of the confirmed CSOs range from 3.6 to 290 pc, all within the canonical < 1 kpc CSO scale (Table A.2). This diverse distribution enables tests of CSO evolution from initial jet launch to early growth of radio structure.
3.2. Core–jet sources
We identified ten core–jet sources in which Gaia positions coincide with the brightest terminal component of an elongated radio structure, which is consistent with relativistic beaming (Fig. S3). A frequency-dependent core shift (systematic position changes with observing frequency due to synchrotron self-absorption gradients along the jet) modulates these alignments (Lobanov & Zensus 1999). Higher radio frequencies probe regions closer to the SMBH, while the optical centroid typically lies even farther upstream (Kovalev et al. 2008). In several sources (e.g., J0753+4231, J1311+1417), the optical position aligns with a weaker upstream component rather than the brightest radio feature, marking the true core locations. In J0003+2129, the Gaia position is displaced toward the counter-jet relative to the radio peak; the absence of radio emission at the optical position is consistent with strong opacity at the jet base, whereas the optical traces the unobscured nucleus. Most optical-radio offsets are < 1 mas and compatible with astrometric uncertainties. The ∼13 mas offset for J2022+6136 likely reflects its faintness and large astrometric uncertainty (G = 20.68). Kinematic analysis (Table S6) shows apparent jet speeds of 0.68 c − 5.43 c, well above the subrelativistic CSO hotspot motions, confirming their relativistic jets.
3.3. CSO candidates
Ten sources show Gaia–VLBI offsets larger than the combined astrometric uncertainties, implying that the Gaia detections may trace unrelated foreground/background objects or extended host features rather than the AGN cores (Bailer-Jones et al. 2019). J0831+4608 and J1254+1856 were observed at only one epoch and frequency; their morphologies are CSO-like, but confirmation requires multi-epoch, multifrequency VLBI to measure spectra and proper motions. J0943+1702 shows a symmetric double at 2.3 GHz with the Gaia position near the midpoint. At 8.7 GHz the structure resolves into N–C–S, with C having flat-spectrum and N/S steep-spectrum. Total-flux variability appears modest (S band), but the apparent ∼2 c hotspot speed is atypical of CSOs and may reflect projection or pattern speeds; we therefore retain a conservative CSO-candidate label. J1823+7938 displays a double-lobe morphology at 2.3 GHz; at 8.4 GHz, the Gaia centroid lies near the E component, which shows flat spectrum, favouring a core+jet geometry. Its roughly symmetric morphology, slow (subluminal) expansion, and low S-band variability are all consistent with a CSO, but the Gaia offset from the geometric midpoint motivates a conservative CSO-candidate classification.
J1559+5924 shows a bright central component with two diffuse extensions, resembling a mini FR I; it remains a CSO candidate, possibly a low-power, two-sided-jet system. J0119+3210, J0906+4636, and J1148+5924 display complex emission without compact, edge-brightened lobes. Their component brightness temperatures (108 − 109 K) and radio powers (L1.4 GHz ∼ 1022 − 1024 W Hz−1) exceed thermal star-formation values yet fall below typical blazar cores, consistent with non-thermal, low-power jets rather than classical CSOs. Also J0650+6001 remains ambiguous: its Gaia position near the southern component suggests a core–jet source, yet the overall GHz-peaked spectrum and slow jet motion (0.35 c) are CSO-like (Orienti & Dallacasa 2010; An et al. 2012; Lister et al. 2019); its strong total-flux variability (from ∼1000 mJy in 2012 to ∼200 mJy in 2021) argues against a standard CSO. These cases highlight classification limitations and the need for a multi-criterion approach. Targeted, multi-epoch and multiband VLBI will be decisive for confirming or rejecting CSO status.
4. Discussion
4.1. Efficacy and validation of the Gaia+VLBI method
Combining Gaia astrometry with VLBI imaging enables robust core identification in compact radio sources. Our confirmation of 20 CSOs demonstrates this method’s effectiveness, providing core localization even when radio cores are faint or obscured, clear separation of CSOs from core–jet systems, independent checks on structure orientation, and improved kinematic baselines.
This method complements radio-only catalogues such as the recent bona fide CSO sample (Kiehlmann et al. 2024a,b): while that catalogue of 79 CSOs, including 43 edge-brightened CSOs (CSO 2 class) with redshifts, applies strict radio-based criteria, our optical–radio registration provides an additional diagnostic. The ∼60% overlap (12/19) between our confirmed CSOs and their list supports the approach. Two cases that are not consistent with the other classifications are classified as core-jet sources (J1816+3457 and J2022+6136), which highlights the known ambiguities in CSO identification. Several important limitations must be considered:
-
Source confusion from foreground or background objects and extended emission from host galaxies can affect centroid positions.
-
Effectiveness decreases for nearby galaxies with complex optical structure.
-
Bias against heavily dust-obscured or optically faint nuclei.
-
Inherent limitation to optically bright sources, restricting application to radio–quiet or very compact sources, particularly at high redshifts.
To mitigate these limitations, we recommend a multiwavelength approach combining data across different bands, careful assessment of host galaxy properties, and integration with traditional radio–based classification methods. Despite caveats, Gaia+VLBI advances early-stage CSO identification where radio-only methods can be inconclusive. Future work will scale to a > 20 000-source cross-match with Astrogeo VLBI, enabling quantitative tests of selection effects, environments, and CSO evolution across diverse populations.
4.2. Radio morphology and spectral properties
Our high-resolution VLBI observations combined with Gaia astrometry reveal diverse morphological and spectral properties that provide key insights into CSO physics and evolution.
The majority (∼70%) of confirmed CSOs exhibit a classical double-lobed structure with edge-brightened hotspots (e.g., J1111+1955, J1358+4737, J1602+2418), supporting theoretical models where young jets propagate symmetrically through a dense ISM. The emission typically becomes detectable when the jet terminates in a shock, efficiently converting kinetic energy into relativistic particles (Blandford & Rees 1974; Begelman et al. 1984; Scheuer 1995; Meisenheimer et al. 1989). For high-power (P1.4 GHz > 1026.5 W Hz−1) jets, kinetic energy is rarely lost as radiation during jet propagation, which often makes the core and inner jet invisible.
Only six CSOs (J0741+2706, J1158+2450, J1234+4753, J1244+4048, J1256+5652, and J1310+3403) are detected with central radio components, which likely represent unresolved inner jet regions rather than cores. Several CSOs display complex morphologies indicating strong jet–ISM interactions. For example, J0832+1832 and J1815+6127 show multiple hotspots suggesting jet deflection or impact with dense ISM clouds (Mendoza & Longair 2002), or jet head impacting multiple sites at the interface (Carvalho & O’Dea 2002; An et al. 2012).
The dramatically bent jet in J1158+2450 provides direct evidence of how strong jet–ISM interactions can sculpt the CSO morphology (Mukherjee et al. 2016). Similarly, the elongated, clumpy jet structure in J1244+4048 likely results from jet instabilities induced by entrainment of the ISM (e.g., Bicknell 1984). In J1256+5652 (Mrk 231), we observe an east-west oriented jet within 2 mas of the core, but extended emission at 20 − 30 mas scales (Wang et al. 2021), hinting at multiple episodes of AGN activity and challenging simple, monotonic evolution models (Saikia & Jamrozy 2009; Brocksopp et al. 2007, 2011; Orienti & Dallacasa 2020). Such recurrent activity (Section 4.2.2), observed in numerous compact radio sources, reveals key aspects of both AGN feedback processes and long-term evolution of radio galaxies (Schoenmakers et al. 2000; Konar et al. 2012; Nandi et al. 2019).
The spectral properties provide additional information on the physical conditions in these sources. The overall radio spectra typically show a convex shape with a turnover near 5 GHz, attributed to synchrotron self-absorption in compact, high-density regions (O’Dea 1998). This characteristic is observed in both low-redshift (z < 1) and high-redshift (z ≥ 1) CSOs (Sotnikova et al. 2021).
The central regions generally exhibit flatter spectra, steepening toward the lobes (e.g., J1234+4753 and J1244+4048); this is consistent with theoretical models of continuous particle acceleration in central regions and is followed by spectral aging as the plasma flows outward (Pacholczyk 1970). The observed morphological and spectral diversity indicates that CSOs are not merely scaled-down versions of larger radio galaxies (An & Baan 2012), they represent crucial laboratories for studying jet-ISM interactions, shock physics, and AGN feedback in action (Tadhunter 2016).
4.2.1. Brightness temperatures and Doppler boosting
Our VLBI observations reveal a distinct contrast between CSOs and other radio-loud AGN classes in their relativistic beaming properties. CSO components typically exhibit moderate brightness temperatures (Tb ∼ 107 − 1010 K) well below the inverse Compton limit of ∼1012 K (Kellermann & Pauliny-Toth 1969; Readhead 1994). This, combined with the derived Doppler-boosting factor of < 1, distinguishes CSOs from highly beamed sources such as blazars (Kovalev et al. 2005; Jorstad et al. 2005; Homan et al. 2006; Hovatta et al. 2009; Liodakis et al. 2018; Cheng et al. 2020). Unlike flat-spectrum radio quasars with a core Tb > 1011 K and Doppler factor of > 10 (Pushkarev & Kovalev 2012), our CSO sample consistently falls below these thresholds (Readhead et al. 1996b; Polatidis & Conway 2003; An & Baan 2012), reinforcing their interpretation as young, intrinsically symmetric sources. Because CSOs have moderate brightness temperatures and little Doppler boosting, the observed Tb closely tracks intrinsic emissivity, enabling beaming-independent estimates of jet energy density, size, and age.
4.2.2. Variability
Flux density variability in CSOs is generally low (Fassnacht & Taylor 2001; Sotnikova et al. 2024) compared to blazars and other core-dominated AGN, which often vary by factors of 2−20 due to relativistic beaming effects (e.g., III Zw 2, Wang et al. 2023a). This stability reflects the dominance of lobe emission (O’Dea 1998; Orienti 2016) and is a key discriminator from highly variable flat-spectrum sources. For the confirmed CSOs with available multi-epoch observations, their total flux densities across the epochs are presented in Fig. S5. In this work, we quantified whole-source variability as V = (Smax − Smin)/(Smax + Smin) using flux densities from epochs with matched (u, v) ranges where feasible. S-band data were prioritised to mitigate short (u, v) spacing losses. Typical calibration systematics are folded into the V uncertainty via quadratic error propagation. Across the confirmed CSOs, V is generally < 20% (Table 1), which is consistent with lobe-dominated emission. Individual components can fluctuate more strongly (Table S7, Fig. S5) but do not dominate the integrated flux densities. Apparent outliers are often attributable to mismatch in short (u, v) spacing or data-quality issues and are excluded from the quantitative V estimate.
The observed size changes in some components correlate with flux-density variations in a pattern consistent with adiabatic expansion of hotspots, where increasing size corresponds to decreasing surface brightness (e.g., Wu et al. 2013). To enhance measurement reliability, we implemented a consistent model-fitting strategy across epochs, using fixed component numbers where appropriate and excluding measurements from epochs with inadequate data quality. The overall stability of CSO emission aligns with theoretical expectations, as their radio emission originates predominantly from extended lobes and hotspots rather than from variable cores, and relativistic beaming effects are minimal due to the large viewing angles typical for these sources.
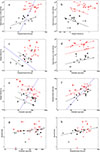 |
Fig. 2. Parameter distributions of sample of 32 CSO sources combined with model predictions. Black symbols denote low-power CSOs (Prad < 1026.5 W Hz−1) and red symbols represent high-power CSOs. The filled symbols are from the current study and the open symbols are from An & Baan (2012). Dashed red and black arrows relate to evolutionary trend for high- and low-power source distributions. The dashed blue lines in panels a, c, and f show the general power trend of the groups as a whole. The dashed blue line in panel b shows the expected survival threshold for low power sources. Panel a: Dashed red and black arrows denote the predicted Prad ∝ D2/3 adiabatic-loss-dominated evolution of a source with constant power, and the dashed blue line indicates the predicted power-size distribution: Prad ∝ D4. Panel b: Dashed red and black arrows show the predicted inverse relationship between radio power and hotspot velocity: |

4.2.3. Hotspot advance speeds and kinematical ages
Based on two decades of VLBI monitoring, we measured hotspot separation speeds of 0.06 c − 2.54 c (subârelativistic), consistent with young, expanding sources (Kawakatu & Kino 2006; Bicknell et al. 2018). We excluded J1111+1955 owing to inconsistent apparent speeds: ∼5.5 c (2015–2018; our measurement) versus < 0.19 c (1997–2002) (Gugliucci et al. 2005). Given its Seyfert II host at z = 0.299 (Urry & Padovani 1995), where large viewing angles disfavour superluminal patterns, and the sparse cadence, we defer interpretation pending uniform, multi-epoch monitoring. Two z > 1.5 quasars (J0943+1702, J1602+2418) show VHS > 2 c separation rates with large uncertainties, plausibly reflecting mildly relativistic jets seen at modest viewing angles. Flux-density-limited selection at high-redshift likely favours such moderately beamed systems. J1110+4817 and J1815+6127 exhibit apparent “contraction” (negative speeds) with bent jet heads, which is consistent with projection and/or pattern-speed effects in curved jets (An et al. 2012). For sources with detected cores, near–far side asymmetries in hotspot speeds likely point to unequal ambient densities on opposite sides of the nucleus (Jeyakumar et al. 2005; Orienti & Dallacasa 2014), providing a direct probe of host-galaxy properties in shaping CSO evolution. These diversities stress the need for long-term, same-frequency VLBI to mitigate component misidentification and core-shift systematics (Scheuer 1995; Owsianik & Conway 1998).
Derived kinematic ages span ∼80 to ≳1800 yr (Table 2); the apparently youngest objects include the two high-z quasars, consistent with flux-limited biases discussed above. The wide age range indicates that we are observing multiple early evolutionary stages (Polatidis & Conway 2003; Gugliucci et al. 2005; An & Baan 2012). The data favour a continuum from genuinely young, growing systems to sources slowed or stalled by dense environments.
Kinematic ages (see Table 2) are considered indicators of the order of magnitude. Key caveats are (i) implicit homogeneity and constant-speed assumptions; (ii) asymmetric and clumpy ISM, inducing side-to-side and temporal speed changes; (iii) opacity and core-shift effects when motions are referenced to the core; and (iv) uncertainties in component identification. Despite these limitations, the ages correlate qualitatively with source size (see Section 4.3), supporting the youth scenario while highlighting environmental regulation of growth.
4.3. Nature and evolution of CSOs
4.3.1. Evolutionary tracks and classification
Our kinematic analysis combines 24 CSOs from An & Baan (2012) with 8 additional sources from this paper, all having measured redshifts and hotspot speeds (Table A.2). Together these 32 objects define the working sample. The relationships in Fig. 2 offer insights into connections between radio power, size, velocity, and age in young radio galaxies.
The power-size correlation (Fig. 2a) demonstrates clear dichotomy in the CSO population, supporting our two-track evolutionary model (An & Baan 2012). A practical threshold at Prad = 1026.5 W Hz−1 (Kunert-Bajraszewska et al. 2010) separates two regimes: above this power, CSOs show a tight correlation with larger sizes, suggesting efficient conversion of jet power into source expansion; below, sources exhibit a more scattered distribution with limited size growth, indicating environmental influence. This dichotomy mirrors the FR I/II division (Fanaroff & Riley 1974; Hardcastle & Croston 2020), reflecting models where high-power jets penetrate ambient medium, while low-power jets face environmental impedance. Although proper-motion requirements are biased in favour of brighter systems, the separation persists across parameters, arguing against a selection artifact.
Self-similar models for young sources expanding into roughly uniform media predict Prad ∝ D2/3 under nearly constant jet power (e.g., Kaiser & Best 2007); we therefore used P − D scalings as diagnostics rather than strict self-similar laws. Such models rely on simplifying assumptions including geometric self-similarity, straightforward pressure balance, and quasi-adiabatic magnetic evolution, which may not hold in realistic environments (e.g., Readhead et al. 2024). We therefore treated Prad − D scaling as diagnostic rather than strict laws. An apparently steeper trend in a subset (sometimes described as Prad ∝ D4) is empirical and likely shaped by population mixing, environmental diversity, and selection effects. In particular, external pressure gradients can regulate jet collimation and advance speeds (e.g., Baan & An 2025), potentially dominating over internal jet microphysics. Jets may be collimated by accretion-disk winds, even on sub-parsec scales, which challenges the concept of strict self-similar evolution. From this perspective, the observed P − D trends reflect how jets interact with ambient pressure profiles rather than idealised self-similar growth.
Figure 2 panels b–f show systematic differences between high-power (red symbols) and low-power (black symbols) CSOs. High-power sources display larger sizes, higher hotspot speeds, and broader age distributions. Radio powers follow theoretical predictions Prad ∝ D2/3 and Prad ∝ T2/5 (where D is projected size and T is age), which is consistent with increasing dynamical work done against the ambient medium as adiabatic losses come to dominate. High-power CSOs (P > 1026.5 W Hz−1) achieve faster hotspot speeds (> 0.2 c) that increase with source size, characterizing young galaxies with sufficient energy flux to penetrate host environments (Kawakatu & Kino 2006). Low-power CSOs show consistently slower speeds (< 0.1 c) regardless of size, suggesting ISM-dominated expansion (O’Dea & Saikia 2021). Spectral evolution (Fig. 2 panels g and h) follows the expected patterns: smaller/youngr CSOs exhibit flatter spectra (α ≈ 0.3 − 0.5) due to synchrotron self-absorption, while larger/older sources steepen toward α ≈ 1.0 as absorption weakens with expansion and radiative aging accumulates.
We examined relationships among key CSO parameters using Pearson correlation analyses (see Sect. S7). Radio power correlates moderately with both projected size and hotspot velocity (r = 0.48), implying that more powerful jets more effectively drive expansion through the ambient medium, producing larger sources and faster hotspots. Hotspot velocity anti-correlates with kinematic age (r = −0.44), pointing to systematic deceleration as CSOs grow. Projected size correlates positively with spectral index (r = 0.38), consistent with synchrotron aging: larger sources host older electrons that have undergone greater radiative and adiabatic losses, leading to steeper spectra.
4.3.2. Evolutionary pathways and feedback mechanisms
The CSO population appears to follow power-dependent evolutionary paths. High-power CSOs sustain growth as jets penetrate dense media, evolving along the CSO → MSO → LSO sequence (MSO/LSO: medium/large-sized symmetric objects). Their broader age distribution implies longer survival with double-lobe morphology, and they provide mechanical feedback that evacuates nuclear gas and can influence host evolution on larger scales (Tadhunter 2016; O’Dea & Saikia 2021).
By contrast, low-power CSOs are typically smaller and expand more slowly, likely environment-limited (Baan & An 2025), often stalling within the ISM. Their narrower size but broader age distributions suggest intermittent or frustrated growth, yielding primarily localized thermal/ISM regulation. Recent work on low-power radio galaxies indicates power-dependent feedback channels with implications for galaxy evolution (Baldi 2023; Chilufya et al. 2024).
The sizable number of lower power CSOs supports a frustrated/confined scenario in which weak jets repeatedly interact with a clumpy ISM, injecting energy in nuclear regions yet failing to develop large-scale radio structures. This successful versus frustrated dichotomy aligns with observations of faint sources embedded in tori or circumnuclear star-forming regions, implying local rather than halo/IGM-scale feedback (Hardcastle & Croston 2020).
Low-power CSOs also show entrainment and energy losses that erode clear lobes (Norman et al. 1982; Kawakatu et al. 2008; Wang et al. 2009), potentially linking to radio-weak AGN (Sadler et al. 2002; Croston et al. 2019; Drake et al. 2024). They are most readily observed in nearby hosts (e.g., J0048+3157/NGC 262; J2355+4950), and some radio-quiet quasars show weak, CSO-like morphologies (Alhosani et al. 2022; Chen et al. 2023; Wang et al. 2023b). A fraction of high-power CSOs may still deviate from their evolutionary paths, becoming dying CSOs/MSOs due to nuclear activity changes or environment interactions (Kunert-Bajraszewska et al. 2010; An & Baan 2012), and may overlap phenomenologically with CSO class 2.2 (Readhead et al. 2024).
4.4. Classification and origin mechanisms
Recent work proposes a power-based CSO dichotomy similar to ours, with edge-dimmed, low-luminosity (CSO 1) and edge-brightened, high-luminosity (CSO 2) classes (Kiehlmann et al. 2024a). We adopted the low-power/weak-jet class in line with Readhead et al. (2024); such systems likely dominate the radio-galaxy population and include many newly recognised young sources from low-frequency surveys (e.g., Hardcastle & Croston 2020; O’Dea & Saikia 2021).
Readhead et al. (2024) argued that many high-power CSOs are transient, powered by TDEs of giant stars (Rees 1988). Our analysis does not support TDEs as the primary engine for most high-power CSOs on several grounds. Concerning (1) hosts, TDEs prefer spiral galaxies (Law-Smith et al. 2017; French et al. 2020), whereas CSOs typically inhabit luminous elliptic or ultraluminous infrared galaxies with classical bulges and higher BH masses, often in post-merger environments (Willett et al. 2010; Tadhunter et al. 2011; Kosmaczewski et al. 2020; Liao & Gu 2020). With regard to (2) morphology and continuity, VLBI frequently shows smoothly connected inner jets feeding edge-brightened hotspots, with inner-jet speeds exceeding hotspot speeds (Taylor et al. 2000; An et al. 2012); this implies sustained power, not rapidly fading transients. In terms of (3) timescales, CSO lifetimes of ∼20−2000 yr (this work) far exceed typical TDE accretion phases (months–years) (Rees 1988; Gezari 2021); even longer-lived TDE disks (∼10 yr) (Metzger & Stone 2016) remain orders of magnitude too short. Concerning (4) energetics, sustained jet powers of 1043 − 1047 erg s−1 over centuries to millennia (total up to ∼7 M⊙ c2; Readhead et al. 2024) greatly exceed typical TDE yields (∼0.1 M⊙ c2; Stone & Metzger 2016). Multiple massive TDEs in quick succession lack support. Regarding (5) rates, the CSO birth rate (∼3 × 10⁻⁵ Gpc−3 yr−1; Readhead et al. 1996b, 2024) is ≳2 orders of magnitude below the TDE rate (∼10−5 Mpc−3 yr−1), and even if only ∼10% produce jets (Alexander et al. 2020), the mismatch persists.
Our interpretation of high-power CSO evolution also differs; whereas Kiehlmann et al. (2024b) posit that most CSO 2s remain compact (D ≤ 500 pc, T ≤ 5000 yr), our data indicate many are early stage FR II systems, with some potentially growing to kpc–Mpc scales; several sources with T > 103 yr and D > 500 pc show continued edge-brightened growth despite moderate hotspot speeds (Polatidis & Conway 2003; An & Baan 2012). Additional AGN-like strong optical lines (Gelderman & Whittle 1994), infrared excess from dust heating (Tadhunter et al. 2011), and obscured-AGN X-ray spectra (Guainazzi et al. 2006; Siemiginowska et al. 2016; Sobolewska et al. 2019) further support long-lived accretion. Extended radio emission beyond CSO scales in some objects (e.g., 0108+388, 1511+0518) argues for recurrent AGN activity (Baum et al. 1990; Orienti & Dallacasa 2008; Kunert-Bajraszewska et al. 2010).
A more plausible engine is standard AGN accretion, fuelled by merger-driven inflows or bar instabilities (Hopkins & Quataert 2010; Storchi-Bergmann & Schnorr-Müller 2019), which is consistent with the prevalence of interacting hosts and the high fraction among IR-luminous galaxies. While rare CSOs might arise from exceptional TDEs, population-level properties favour conventional AGN. Selection biases from Gaia (optically brighter, lower-z systems) are acknowledged, but radio evolutionary trends appear consistent across Gaia-detected and non-detected subsamples.
Forthcoming Square Kilometre Array (SKA) surveys will uncover weaker CSOs and clarify the transition around P1.4 GHz ≲ 1025 W Hz−1. SKA pathfinders already improve demographic baselines for FR I/II samples (e.g., Hardcastle et al. 2019; Mingo et al. 2019; White et al. 2020a,b; Sejake et al. 2023). Ultimately, capturing the full CSO population, rather than only bright or peculiar subsets, will reveal more diverse evolutionary paths and sharpen constraints on radio-galaxy growth and AGN feedback.
5. Summary
In this study, we developed and validated a Gaia+VLBI method to identify and characterize CSOs. Our main findings are listed as follows.
-
The Gaia+VLBI approach decisively classifies 30 out of 40 candidates: 20 confirmed CSOs (15 via direct Gaia–VLBI alignment; 5 via morphology/spectra despite larger offsets) and ten core–jet sources; ten remain ambiguous. This overcomes the long-standing difficulty of locating faint/absorbed radio cores in young sources. Scaling this Gaia+VLBI framework to larger samples, especially with sensitive SKA-era observations of low-power CSOs, will reveal hidden populations and sharpen constraints on feedback, frustrated sources, and host-galaxy-jet coupling across cosmic time.
-
The two-track evolutionary paradigm is reinforced by multiple, independent observational correlations presented here. High-power CSOs (Prad > 1026.5 W Hz−1) show moderate hotspot speeds (typically 0.2 − 0.5 c), systematic spectral gradients, and potential growth into large radio galaxies. Low-power CSOs remain sub-kiloparsec with slower expansion (< 0.1 c) and strong environmental imprint, consistent with the frustrated radio galaxy picture. Correlations among radio power, size, hotspot speed, and kinematic age match theoretical expectations, implying distinct trajectories set largely by initial radio power.
-
The properties of CSOs suggest that isolated TDEs are unlikely to be the dominant origin: long activity, persistent symmetry, and energy budgets in some CSOs instead point to standard AGN fueling.
-
Beyond power, evolution reflects environment and duty cycle: ambient density and magneto-ionic conditions, intermittent accretion, engine lifetime shape morphology, spectra, and growth, hence the observed diversity of observational characteristics.
-
Compact symmetric objects are laboratories for AGN feedback: high-power systems deliver mechanical work on larger scales; low-power systems heat and disturb the central ISM without developing large lobes.
Data availability
The VLBI datasets underlying this article were derived from the public domain in the Astrogeo archive (http://astrogeo.org/). The materials originally presented as appendices are available as online supplementary material at Zenodo (DOI: https://doi.org/10.5281/zenodo.17278723). Figure and table numbering in the supplement follows the S-scheme (e.g. Fig. S1, Table S1).
Acknowledgments
We thank the referee for the constructive comments that improved the paper. TA and WAB are grateful to Anthony C. Readhead for his constructive discussions and valuable suggestions. This work is supported by the National Key R&D Program of China (2022SKA0120102). This work used resources of China SKA Regional Centre prototype funded by the Ministry of Science and Technology of the People’s Republic of China and the Chinese Academy of Sciences (An et al. 2019, 2022). TA and WAB acknowledge the support from the Xinjiang Tianchi Talent Program. YKZ is supported by the China Scholarship Council (No. 202104910165), the Shanghai Sailing Program under grant number 22YF1456100, and the Strategic Priority Research Program of the Chinese Academy of Sciences (Grant No. XDA0350205). YKZ thanks for the warm hospitality and the helpful comments from Ivy Wong in CSIRO Space & Astronomy in Australia. YKZ thanks for the valuable suggestions and comments from Krisztina Éva Gabányi in Konkoly Observatory, Hungary. SF thanks the Hungarian National Research, Development and Innovation Office (NKFIH, grant no. OTKA K134213) for support. This work was also supported by the NKFIH excellence grant TKP2021-NKTA-64. The authors acknowledge the use of Astrogeo Center database maintained by L. Petrov. This work has made use of data from the European Space Agency (ESA) mission Gaia (https://www.cosmos.esa.int/gaia), processed by the Gaia Data Processing and Analysis Consortium (DPAC, https://www.cosmos.esa.int/web/gaia/dpac/consortium). This work has made use of the NASA Astrophysics Data System Abstract Service, and the NASA/IPAC Extragalactic Database (NED), which is operated by the Jet Propulsion Laboratory, California Institute of Technology, under contract with the National Aeronautics and Space Administration. The National Radio Astronomy Observatory is a facility of the National Science Foundation operated under cooperative agreement by Associated Universities, Inc.
References
- Alexander, K. D., van Velzen, S., Horesh, A., & Zauderer, B. A. 2020, Space Sci. Rev., 216, 81 [CrossRef] [Google Scholar]
- Alhosani, A., Gelfand, J. D., Zaw, I., et al. 2022, ApJ, 936, 73 [NASA ADS] [CrossRef] [Google Scholar]
- An, T., & Baan, W. A. 2012, ApJ, 760, 77 [Google Scholar]
- An, T., Wu, F., Yang, J., et al. 2012, ApJS, 198, 5 [NASA ADS] [CrossRef] [Google Scholar]
- An, T., Wu, X.-P., & Hong, X. 2019, Nat. Astron., 3, 1030 [NASA ADS] [CrossRef] [Google Scholar]
- An, T., Wu, X., Lao, B., et al. 2022, Sci. China Phys. Mech. Astron., 65, 129501 [NASA ADS] [CrossRef] [Google Scholar]
- Baan, W. A., & An, T. 2025, ApJ, 980, 119 [Google Scholar]
- Bailer-Jones, C. A. L., Fouesneau, M., & Andrae, R. 2019, MNRAS, 490, 5615 [CrossRef] [Google Scholar]
- Baldi, R. D. 2023, A&ARv, 31, 3 [NASA ADS] [CrossRef] [Google Scholar]
- Baldi, R. D., Capetti, A., & Massaro, F. 2018, A&A, 609, A1 [NASA ADS] [CrossRef] [EDP Sciences] [Google Scholar]
- Baldi, R. D., Capetti, A., & Giovannini, G. 2019, MNRAS, 482, 2294 [NASA ADS] [CrossRef] [Google Scholar]
- Baldwin, J. E. 1982, IAU Symp., 97, 21 [Google Scholar]
- Baum, S. A., O’Dea, C. P., Murphy, D. W., & de Bruyn, A. G. 1990, A&A, 232, 19 [NASA ADS] [Google Scholar]
- Begelman, M. C., Blandford, R. D., & Rees, M. J. 1984, Rev. Mod. Phys., 56, 255 [Google Scholar]
- Bicknell, G. V. 1984, ApJ, 286, 68 [NASA ADS] [CrossRef] [Google Scholar]
- Bicknell, G. V., Mukherjee, D., Wagner, A. Y., Sutherland, R. S., & Nesvadba, N. P. H. 2018, MNRAS, 475, 3493 [NASA ADS] [CrossRef] [Google Scholar]
- Blandford, R. D., & Rees, M. J. 1974, MNRAS, 169, 395 [NASA ADS] [CrossRef] [Google Scholar]
- Brocksopp, C., Kaiser, C. R., Schoenmakers, A. P., & de Bruyn, A. G. 2007, MNRAS, 382, 1019 [NASA ADS] [CrossRef] [Google Scholar]
- Brocksopp, C., Kaiser, C. R., Schoenmakers, A. P., & de Bruyn, A. G. 2011, MNRAS, 410, 484 [CrossRef] [Google Scholar]
- Carvalho, J. C., & O’Dea, C. P. 2002, ApJS, 141, 337 [Google Scholar]
- Chen, S., Laor, A., Behar, E., Baldi, R. D., & Gelfand, J. D. 2023, MNRAS, 525, 164 [Google Scholar]
- Cheng, X. P., An, T., Frey, S., et al. 2020, ApJS, 247, 57 [NASA ADS] [CrossRef] [Google Scholar]
- Chilufya, J., Hardcastle, M. J., Pierce, J. C. S., et al. 2024, MNRAS, 529, 1472 [NASA ADS] [CrossRef] [Google Scholar]
- Croston, J. H., Hardcastle, M. J., Mingo, B., et al. 2019, A&A, 622, A10 [NASA ADS] [CrossRef] [EDP Sciences] [Google Scholar]
- Czerny, B., Siemiginowska, A., Janiuk, A., Nikiel-Wroczyński, B., & Stawarz, Ł. 2009, ApJ, 698, 840 [NASA ADS] [CrossRef] [Google Scholar]
- De Young, D. S. 1993, ApJ, 402, 95 [NASA ADS] [CrossRef] [Google Scholar]
- DESI Collaboration (Abdul-Karim, M., et al.) 2025, ArXiv e-prints [arXiv:2503.14745] [Google Scholar]
- Drake, A. B., Smith, D. J. B., Hardcastle, M. J., et al. 2024, MNRAS, 534, 1107 [NASA ADS] [CrossRef] [Google Scholar]
- Fanaroff, B. L., & Riley, J. M. 1974, MNRAS, 167, 31P [Google Scholar]
- Fanti, C. 2009, Astron. Nachr., 330, 120 [NASA ADS] [CrossRef] [Google Scholar]
- Fanti, C., Fanti, R., Dallacasa, D., et al. 1995, A&A, 302, 317 [NASA ADS] [Google Scholar]
- Fassnacht, C. D., & Taylor, G. B. 2001, AJ, 122, 1661 [Google Scholar]
- French, K. D., Wevers, T., Law-Smith, J., Graur, O., & Zabludoff, A. I. 2020, Space Sci. Rev., 216, 32 [CrossRef] [Google Scholar]
- Gaia Collaboration (Prusti, T., et al.) 2016, A&A, 595, A1 [NASA ADS] [CrossRef] [EDP Sciences] [Google Scholar]
- Gaia Collaboration (Vallenari, A., et al.) 2023, A&A, 674, A1 [NASA ADS] [CrossRef] [EDP Sciences] [Google Scholar]
- Gelderman, R., & Whittle, M. 1994, ApJS, 91, 491 [NASA ADS] [CrossRef] [Google Scholar]
- Gezari, S. 2021, ARA&A, 59, 21 [NASA ADS] [CrossRef] [Google Scholar]
- Guainazzi, M., Siemiginowska, A., Stanghellini, C., et al. 2006, A&A, 446, 87 [NASA ADS] [CrossRef] [EDP Sciences] [Google Scholar]
- Gugliucci, N. E., Taylor, G. B., Peck, A. B., & Giroletti, M. 2005, ApJ, 622, 136 [NASA ADS] [CrossRef] [Google Scholar]
- Hardcastle, M. J., & Croston, J. H. 2020, New Astron. Rev., 88, 101539 [Google Scholar]
- Hardcastle, M. J., Williams, W. L., Best, P. N., et al. 2019, A&A, 622, A12 [NASA ADS] [CrossRef] [EDP Sciences] [Google Scholar]
- Healey, S. E., Romani, R. W., Taylor, G. B., et al. 2007, ApJS, 171, 61 [Google Scholar]
- Homan, D. C., Kovalev, Y. Y., Lister, M. L., et al. 2006, ApJ, 642, L115 [NASA ADS] [CrossRef] [Google Scholar]
- Hopkins, P. F., & Quataert, E. 2010, MNRAS, 407, 1529 [Google Scholar]
- Hovatta, T., Valtaoja, E., Tornikoski, M., & Lähteenmäki, A. 2009, A&A, 494, 527 [CrossRef] [EDP Sciences] [Google Scholar]
- Janiuk, A., Czerny, B., & Siemiginowska, A. 2002, ApJ, 576, 908 [NASA ADS] [CrossRef] [Google Scholar]
- Jeyakumar, S., Wiita, P. J., Saikia, D. J., & Hooda, J. S. 2005, A&A, 432, 823 [NASA ADS] [CrossRef] [EDP Sciences] [Google Scholar]
- Jorstad, S. G., Marscher, A. P., Lister, M. L., et al. 2005, AJ, 130, 1418 [Google Scholar]
- Joshi, S. A., Nandi, S., Saikia, D. J., Ishwara-Chandra, C. H., & Konar, C. 2011, MNRAS, 414, 1397 [NASA ADS] [CrossRef] [Google Scholar]
- Kaiser, C. R., & Best, P. N. 2007, MNRAS, 381, 1548 [Google Scholar]
- Kaiser, C. R., Schoenmakers, A. P., & Röttgering, H. J. A. 2000, MNRAS, 315, 381 [Google Scholar]
- Kawakatu, N., & Kino, M. 2006, MNRAS, 370, 1513 [Google Scholar]
- Kawakatu, N., Nagai, H., & Kino, M. 2008, ApJ, 687, 141 [NASA ADS] [CrossRef] [Google Scholar]
- Kellermann, K. I., & Pauliny-Toth, I. I. K. 1969, ApJ, 155, L71 [NASA ADS] [CrossRef] [Google Scholar]
- Kiehlmann, S., Lister, M. L., Readhead, A. C. S., et al. 2024a, ApJ, 961, 240 [NASA ADS] [CrossRef] [Google Scholar]
- Kiehlmann, S., Readhead, A. C. S., O’Neill, S., et al. 2024b, ApJ, 961, 241 [NASA ADS] [CrossRef] [Google Scholar]
- Konar, C., & Hardcastle, M. J. 2013, MNRAS, 436, 1595 [NASA ADS] [CrossRef] [Google Scholar]
- Konar, C., Hardcastle, M. J., Jamrozy, M., Croston, J. H., & Nandi, S. 2012, MNRAS, 424, 1061 [Google Scholar]
- Kosmaczewski, E., Stawarz, Ł., Siemiginowska, A., et al. 2020, ApJ, 897, 164 [NASA ADS] [CrossRef] [Google Scholar]
- Kosogorov, N. A., Kovalev, Y. Y., Perucho, M., & Kovalev, Y. A. 2024, MNRAS, 528, 1697 [NASA ADS] [CrossRef] [Google Scholar]
- Kovalev, Y. Y., Kellermann, K. I., Lister, M. L., et al. 2005, AJ, 130, 2473 [Google Scholar]
- Kovalev, Y. Y., Lobanov, A. P., Pushkarev, A. B., & Zensus, J. A. 2008, A&A, 483, 759 [NASA ADS] [CrossRef] [EDP Sciences] [Google Scholar]
- Kunert-Bajraszewska, M., Gawroński, M. P., Labiano, A., & Siemiginowska, A. 2010, MNRAS, 408, 2261 [NASA ADS] [CrossRef] [Google Scholar]
- Law-Smith, J., Ramirez-Ruiz, E., Ellison, S. L., & Foley, R. J. 2017, ApJ, 850, 22 [Google Scholar]
- Liao, M., & Gu, M. 2020, MNRAS, 491, 92 [NASA ADS] [CrossRef] [Google Scholar]
- Liodakis, I., Hovatta, T., Huppenkothen, D., et al. 2018, ApJ, 866, 137 [Google Scholar]
- Lister, M. L., Homan, D. C., Hovatta, T., et al. 2019, ApJ, 874, 43 [NASA ADS] [CrossRef] [Google Scholar]
- Lobanov, A. P., & Zensus, J. A. 1999, ApJ, 521, 509 [Google Scholar]
- Machalski, J., Jamrozy, M., & Konar, C. 2010, A&A, 510, A84 [NASA ADS] [CrossRef] [EDP Sciences] [Google Scholar]
- Mahatma, V. H., Hardcastle, M. J., Williams, W. L., et al. 2019, A&A, 622, A13 [NASA ADS] [CrossRef] [EDP Sciences] [Google Scholar]
- Marecki, A., & Szablewski, M. 2009, A&A, 506, L33 [EDP Sciences] [Google Scholar]
- Marr, J. M., Taylor, G. B., & Crawford, F. 2001, ApJ, 550, 160 [Google Scholar]
- Meisenheimer, K., Roser, H. J., Hiltner, P. R., et al. 1989, A&A, 219, 63 [NASA ADS] [Google Scholar]
- Mendoza, S., & Longair, M. S. 2002, MNRAS, 331, 323 [Google Scholar]
- Metzger, B. D., & Stone, N. C. 2016, MNRAS, 461, 948 [NASA ADS] [CrossRef] [Google Scholar]
- Mingo, B., Croston, J. H., Hardcastle, M. J., et al. 2019, MNRAS, 488, 2701 [NASA ADS] [CrossRef] [Google Scholar]
- Mukherjee, D., Bicknell, G. V., Sutherland, R., & Wagner, A. 2016, MNRAS, 461, 967 [NASA ADS] [CrossRef] [Google Scholar]
- Nandi, S., Saikia, D. J., Roy, R., et al. 2019, MNRAS, 486, 5158 [CrossRef] [Google Scholar]
- Norman, M. L., Winkler, K. H. A., Smarr, L., & Smith, M. D. 1982, A&A, 113, 285 [NASA ADS] [Google Scholar]
- O’Dea, C. P. 1998, PASP, 110, 493 [Google Scholar]
- O’Dea, C. P., & Saikia, D. J. 2021, A&ARv, 29, 3 [Google Scholar]
- O’Dea, C. P., Baum, S. A., & Stanghellini, C. 1991, ApJ, 380, 66 [CrossRef] [Google Scholar]
- Orienti, M. 2016, Astron. Nachr., 337, 9 [Google Scholar]
- Orienti, M., & Dallacasa, D. 2008, A&A, 487, 885 [NASA ADS] [CrossRef] [EDP Sciences] [Google Scholar]
- Orienti, M., & Dallacasa, D. 2010, MNRAS, 406, 529 [NASA ADS] [CrossRef] [Google Scholar]
- Orienti, M., & Dallacasa, D. 2014, MNRAS, 438, 463 [NASA ADS] [CrossRef] [Google Scholar]
- Orienti, M., & Dallacasa, D. 2020, MNRAS, 499, 1340 [NASA ADS] [CrossRef] [Google Scholar]
- Orienti, M., Dallacasa, D., Tinti, S., & Stanghellini, C. 2006, A&A, 450, 959 [NASA ADS] [CrossRef] [EDP Sciences] [Google Scholar]
- Orienti, M., Murgia, M., Dallacasa, D., Migliori, G., & D’Ammando, F. 2023, MNRAS, 522, 3877 [CrossRef] [Google Scholar]
- Owsianik, I., & Conway, J. E. 1998, A&A, 337, 69 [NASA ADS] [Google Scholar]
- Pacholczyk, A. G. 1970, Radio Astrophysics. Nonthermal Processes in Galactic and Extragalactic Sources (San Francisco: Freeman) [Google Scholar]
- Pearson, T. J., & Readhead, A. C. S. 1981, ApJ, 248, 61 [Google Scholar]
- Pearson, T. J., & Readhead, A. C. S. 1988, ApJ, 328, 114 [Google Scholar]
- Peck, A. B., & Taylor, G. B. 2000, ApJ, 534, 90 [NASA ADS] [CrossRef] [Google Scholar]
- Peck, A. B., Taylor, G. B., & Conway, J. E. 1999, ApJ, 521, 103 [Google Scholar]
- Petrov, L., & Kovalev, Y. Y. 2017, MNRAS, 467, L71 [Google Scholar]
- Petrov, L. Y., & Kovalev, Y. Y. 2025, ApJS, 276, 38 [NASA ADS] [CrossRef] [Google Scholar]
- Phillips, R. B., & Mutel, R. L. 1980, ApJ, 236, 89 [NASA ADS] [CrossRef] [Google Scholar]
- Phillips, R. B., & Mutel, R. L. 1982, A&A, 106, 21 [NASA ADS] [Google Scholar]
- Plavin, A. V., Kovalev, Y. Y., & Petrov, L. Y. 2019, ApJ, 871, 143 [Google Scholar]
- Polatidis, A. G., & Conway, J. E. 2003, PASA, 20, 69 [Google Scholar]
- Pushkarev, A. B., & Kovalev, Y. Y. 2012, A&A, 544, A34 [NASA ADS] [CrossRef] [EDP Sciences] [Google Scholar]
- Readhead, A. C. S. 1994, ApJ, 426, 51 [Google Scholar]
- Readhead, A. C. S., Taylor, G. B., Pearson, T. J., & Wilkinson, P. N. 1996a, ApJ, 460, 634 [NASA ADS] [CrossRef] [Google Scholar]
- Readhead, A. C. S., Taylor, G. B., Xu, W., et al. 1996b, ApJ, 460, 612 [NASA ADS] [CrossRef] [Google Scholar]
- Readhead, A. C. S., Ravi, V., Blandford, R. D., et al. 2024, ApJ, 961, 242 [Google Scholar]
- Rees, M. J. 1988, Nature, 333, 523 [Google Scholar]
- Sadler, E. M., Jackson, C. A., Cannon, R. D., et al. 2002, MNRAS, 329, 227 [Google Scholar]
- Saikia, D. J., & Jamrozy, M. 2009, Bull. Astron. Soc. India, 37, 63 [NASA ADS] [Google Scholar]
- Scheuer, P. A. G. 1995, MNRAS, 277, 331 [NASA ADS] [Google Scholar]
- Schoenmakers, A. P., de Bruyn, A. G., Röttgering, H. J. A., & van der Laan, H. 2000, MNRAS, 315, 395 [NASA ADS] [CrossRef] [Google Scholar]
- Sejake, P. K., White, S. V., Heywood, I., et al. 2023, MNRAS, 518, 4290 [Google Scholar]
- Siemiginowska, A., Czerny, B., Janiuk, A., et al. 2010, ASP Conf. Ser., 427, 326 [Google Scholar]
- Siemiginowska, A., Sobolewska, M., Migliori, G., et al. 2016, ApJ, 823, 57 [NASA ADS] [CrossRef] [Google Scholar]
- Snellen, I. A. G., Schilizzi, R. T., Miley, G. K., et al. 2000, MNRAS, 319, 445 [NASA ADS] [CrossRef] [Google Scholar]
- Sobolewska, M., Siemiginowska, A., Guainazzi, M., et al. 2019, ApJ, 871, 71 [NASA ADS] [CrossRef] [Google Scholar]
- Sotnikova, Y., Mikhailov, A., Mufakharov, T., et al. 2021, MNRAS, 508, 2798 [CrossRef] [Google Scholar]
- Sotnikova, Y., Mikhailov, A., Mufakharov, T., et al. 2024, Galaxies, 12, 25 [NASA ADS] [CrossRef] [Google Scholar]
- Stanghellini, C., Bondi, M., Dallacasa, D., et al. 1997, A&A, 318, 376 [NASA ADS] [Google Scholar]
- Stone, N. C., & Metzger, B. D. 2016, MNRAS, 455, 859 [NASA ADS] [CrossRef] [Google Scholar]
- Storchi-Bergmann, T., & Schnorr-Müller, A. 2019, Nat. Astron., 3, 48 [Google Scholar]
- Tadhunter, C. 2016, A&ARv, 24, 10 [Google Scholar]
- Tadhunter, C., Holt, J., González Delgado, R., et al. 2011, MNRAS, 412, 960 [NASA ADS] [Google Scholar]
- Taylor, G. B., Readhead, A. C. S., & Pearson, T. J. 1996a, ApJ, 463, 95 [NASA ADS] [CrossRef] [Google Scholar]
- Taylor, G. B., Vermeulen, R. C., Readhead, A. C. S., et al. 1996b, ApJS, 107, 37 [Google Scholar]
- Taylor, G. B., Marr, J. M., Pearson, T. J., & Readhead, A. C. S. 2000, ApJ, 541, 112 [NASA ADS] [CrossRef] [Google Scholar]
- Tremblay, S. E., Taylor, G. B., Ortiz, A. A., et al. 2016, MNRAS, 459, 820 [NASA ADS] [CrossRef] [Google Scholar]
- Urry, C. M., & Padovani, P. 1995, PASP, 107, 803 [NASA ADS] [CrossRef] [Google Scholar]
- van Breugel, W., Miley, G., & Heckman, T. 1984, AJ, 89, 5 [Google Scholar]
- Wang, Y., Kaiser, C. R., Laing, R., et al. 2009, MNRAS, 397, 1113 [CrossRef] [Google Scholar]
- Wang, A., An, T., Jaiswal, S., et al. 2021, MNRAS, 504, 3823 [NASA ADS] [CrossRef] [Google Scholar]
- Wang, A., An, T., Guo, S., et al. 2023a, ApJ, 944, 187 [Google Scholar]
- Wang, A., An, T., Zhang, Y., et al. 2023b, MNRAS, 525, 6064 [NASA ADS] [CrossRef] [Google Scholar]
- White, S. V., Franzen, T. M. O., Riseley, C. J., et al. 2020a, PASA, 37, e018 [NASA ADS] [CrossRef] [Google Scholar]
- White, S. V., Franzen, T. M. O., Riseley, C. J., et al. 2020b, PASA, 37, e017 [NASA ADS] [CrossRef] [Google Scholar]
- Wilkinson, P. N., Booth, R. S., Cornwell, T. J., & Clark, R. R. 1984, Nature, 308, 619 [NASA ADS] [CrossRef] [Google Scholar]
- Willett, K. W., Stocke, J. T., Darling, J., & Perlman, E. S. 2010, ApJ, 713, 1393 [NASA ADS] [CrossRef] [Google Scholar]
- Wu, Q. 2009, ApJ, 701, L95 [Google Scholar]
- Wu, F., An, T., Baan, W. A., et al. 2013, A&A, 550, A113 [NASA ADS] [CrossRef] [EDP Sciences] [Google Scholar]
Additional figures, tables, and methods are available at Zenodo (https://doi.org/10.5281/zenodo.17278723). Figure and table numbering in Supplementary Material follows the S-scheme (e.g., Fig. S1, Table S1).
Appendix A: Supplementary tables
The CSO candidate sample collected in this paper.
CSO parameters used in Fig. 2 in the main paper.
All Tables
All Figures
|
Fig. 1. Flowchart of our sample selection procedure. P&T2000: Peck & Taylor (2000); A&B2012: An & Baan (2012); T2016: Tremblay et al. (2016). The Radio Fundamental catalogue (RFC): http://astrogeo.org/rfc/ (Petrov & Kovalev 2025). Gaia DR3: https://www.cosmos.esa.int/web/gaia/data-release-3. |
| In the text | |
|
Fig. 2. Parameter distributions of sample of 32 CSO sources combined with model predictions. Black symbols denote low-power CSOs (Prad < 1026.5 W Hz−1) and red symbols represent high-power CSOs. The filled symbols are from the current study and the open symbols are from An & Baan (2012). Dashed red and black arrows relate to evolutionary trend for high- and low-power source distributions. The dashed blue lines in panels a, c, and f show the general power trend of the groups as a whole. The dashed blue line in panel b shows the expected survival threshold for low power sources. Panel a: Dashed red and black arrows denote the predicted Prad ∝ D2/3 adiabatic-loss-dominated evolution of a source with constant power, and the dashed blue line indicates the predicted power-size distribution: Prad ∝ D4. Panel b: Dashed red and black arrows show the predicted inverse relationship between radio power and hotspot velocity: |
| In the text | |
Current usage metrics show cumulative count of Article Views (full-text article views including HTML views, PDF and ePub downloads, according to the available data) and Abstracts Views on Vision4Press platform.
Data correspond to usage on the plateform after 2015. The current usage metrics is available 48-96 hours after online publication and is updated daily on week days.
Initial download of the metrics may take a while.