Fig. 10
Download original image
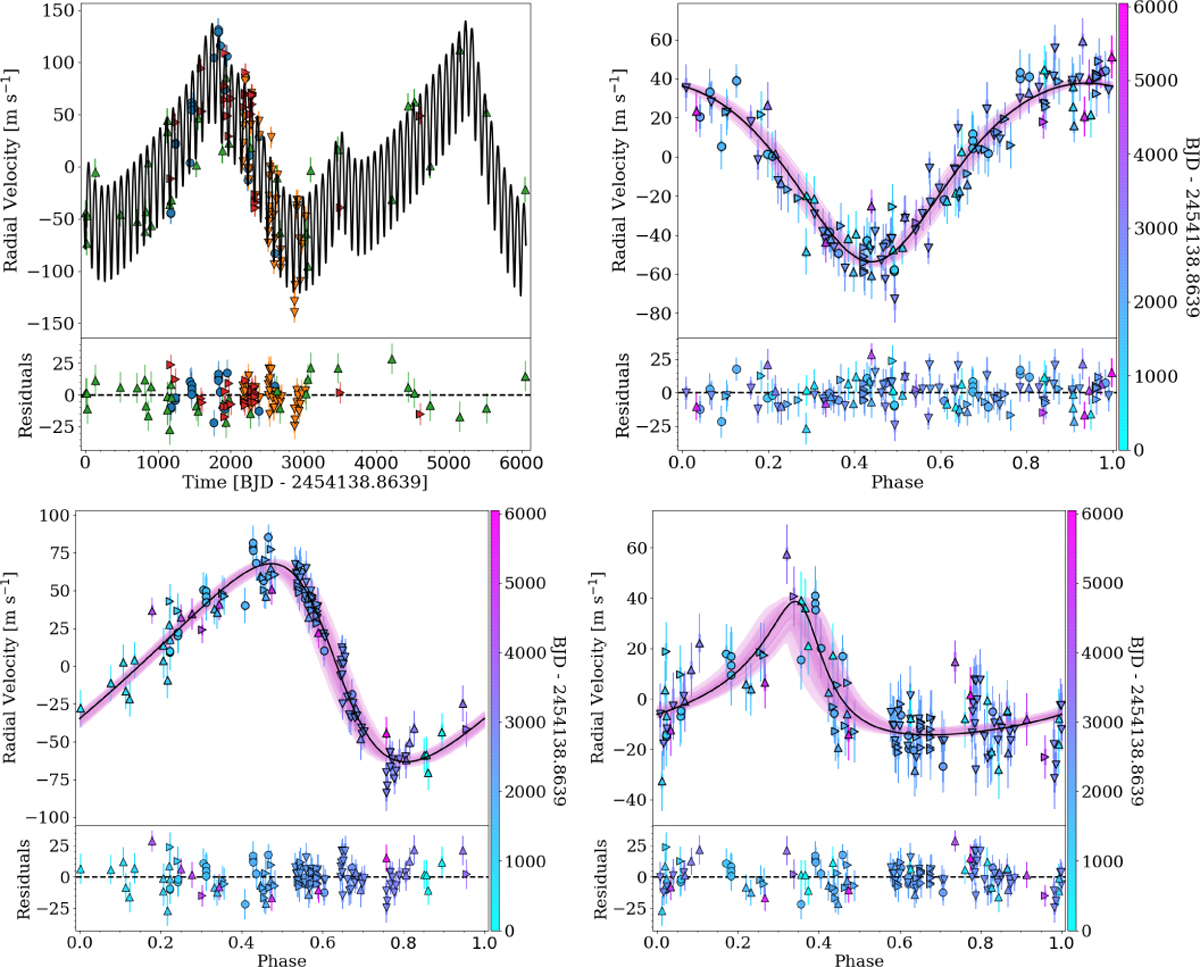
The upper left plot shows the best fit Keplerian model (black curve) for the RV timeseries of HIP 67851, where the datasets shown are from UCLES (blue circles), FEROS (red triangles), Chiron (orange triangles), and Coralie (green triangles). The model residuals are also in the lower panel of the plot. The upper right plot and both lower plots show the phase-folded RVs for the first, second, and third planets detected in the system, respectively. The shaded pink regions mark the 1,2, and 3σ confidence boundaries around the model, and again the lower panels represent the residuals to the model fits.
Current usage metrics show cumulative count of Article Views (full-text article views including HTML views, PDF and ePub downloads, according to the available data) and Abstracts Views on Vision4Press platform.
Data correspond to usage on the plateform after 2015. The current usage metrics is available 48-96 hours after online publication and is updated daily on week days.
Initial download of the metrics may take a while.